Midwest Report

Heat in the Heartland: Climate Change and Economic Risk in the Midwest

This report identifies the economic risks posed by a changing climate to the Midwestern U.S.. The Midwest will likely be hit hard by impacts such as decreased labor productivity, increased energy demand, and increased heat-related mortality. This publication also includes a specific focus on the effects that climate change will have on agriculture and Midwestern cities.

Explore by region

Executive Summary

The Midwestern United States1 is called “the Heartland” for a reason. The region is our nation’s center for commodity agriculture, manufacturing, and transportation logistics. It’s also home to vibrant cities, dense forests, and countless tributaries and lakes. All told, it is one of the most economically productive regions of America.

But climate change puts that productivity at risk. While this is an area accustomed to dramatic weather events, the extremes that are likely to come with climate change are on an entirely different scale for the region’s businesses, communities, and overall economic health.

Rising heat resulting from increased greenhouse gas emissions is likely to affect the Midwest region’s ten major metropolitan areas through higher heat-related mortality, increased electricity demand and energy costs, and declines in labor productivity. Meanwhile, without significant adaptation on the part of Midwest farmers, the region’s thriving agricultural sector—particularly in the southern states—is likely to suffer yield losses and economic damages as temperatures rise.

In addition, potential changes in the intensity, form, and timing of precipitation in the region—including snowfall, rain, and evaporation off the Great Lakes and Mississippi River—will pose challenges for regional infrastructure managers, farmers, and businesses.

The mission of the Risky Business Project is to quantify the economic risks to the U.S. from unmitigated climate change. Our inaugural report, Risky Business: The Economic Risks of Climate Change in the United States,2 highlighted these risks across every region of the country, with a focus on three sectors: agriculture, energy demand, and coastal infrastructure. We also looked at overarching issues such as changes in labor productivity, heat-related mortality, and crime. This follow-up report, Heat in the Heartland: Climate Change and Economic Risk in the Midwest, zeros in on the Midwest and offers a first step toward defining the range of potential economic consequences to this particular region if we continue on our current greenhouse gas emissions pathway.3

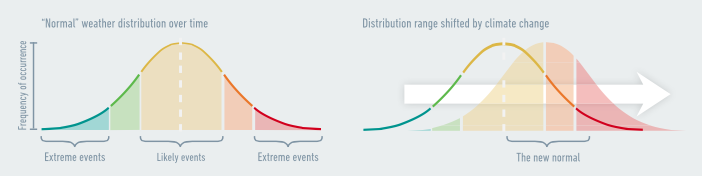
Our research combines state-of-the-art climate science projections through the year 2100 (and beyond in some cases) with empirically-derived estimates of the impact of projected changes in temperature and precipitation on the Midwest economy. We analyze not only those outcomes most likely to occur, but also lower-probability, higher-cost climate futures. These are the “tail risks,” most often expressed here as the 1-in-20 chance something will occur. Unlike any other study to date, we look at climate impacts at a very geographically granular level, in some cases providing county-level results.

Our findings show that if we stay on our current emissions path, the Midwest will likely experience significant economic impacts from climate change. These changes are both negative and positive, varying greatly from the southern to the northern parts of the region. However, if the region chooses a different path—if state and regional policymakers and business leaders act aggressively to adapt to the changing climate and also to mitigate future impacts by reducing their own carbon emissions—the Midwest can demonstrate to our national and global political leaders the kind of strong response that is necessary to reduce the worst future economic risks from climate change.

Heat in the Heartland—Extreme Heat Likely to Hit Midwest Agriculture, Manufacturing, and Cities

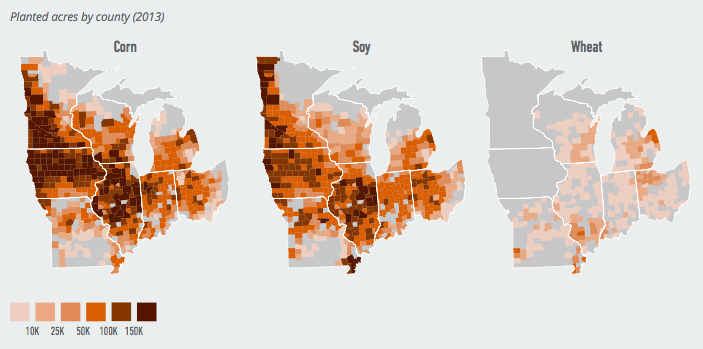
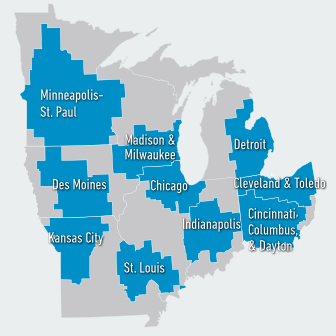
As a region, the Midwest is home to nearly one in five Americans and includes many of the nation’s most populous cities, including Chicago, Minneapolis-St. Paul, Indianapolis, Columbus, Detroit, Milwaukee, Kansas City, Cleveland, and St. Louis. The region is also known for both agriculture and energy-intensive manufacturing: The Midwest is responsible for 65% of U.S. production of corn and soybeans,4 a significant share of the national wheat crop, and about a third of all U.S. manufacturing operations.5

Without action, climate change will lock in extreme temperature increases across the Midwest, bringing severe risks to the southern states’ economies, and potentially some moderate temperature and agricultural benefits to states in the northern part of the region. These risks include:

  • By the end of this century, dangerous levels of extreme heat are likely across the southern Midwest.
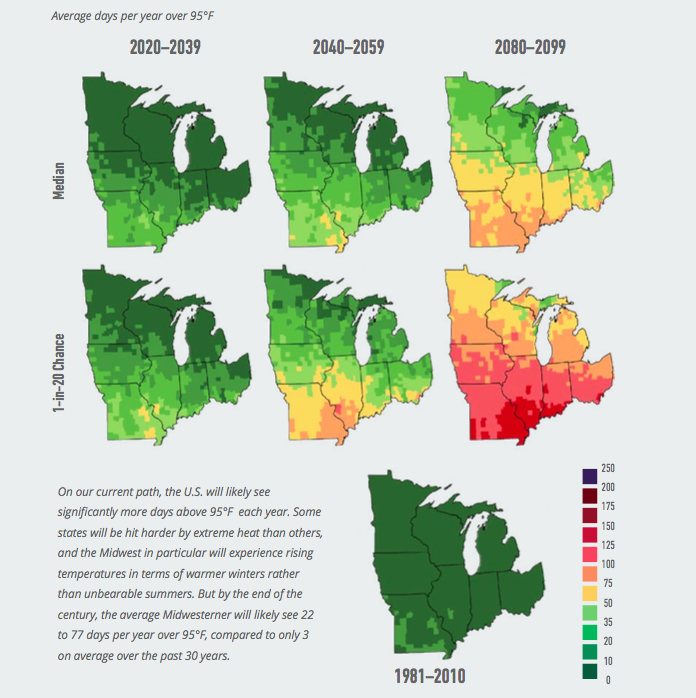
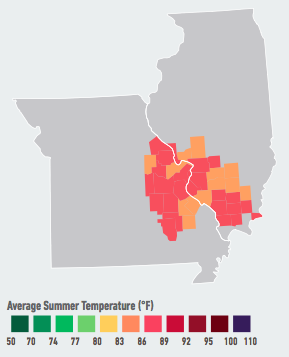
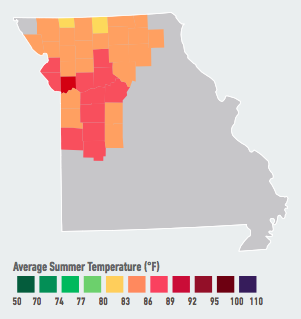
    • By the end of this century, the average Missouri resident will likely experience 46 to 115 days above 95°F in a typical year—about as many extremely hot days as the average Arizonan has experienced each year in recent decades. There is a 1-in-20 chance that Missouri will experience more than 125 such days by the end of the century.
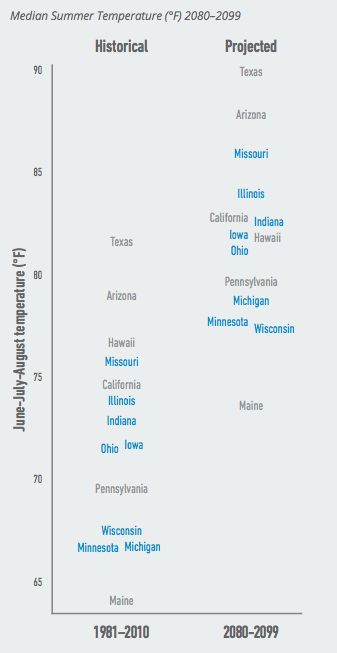
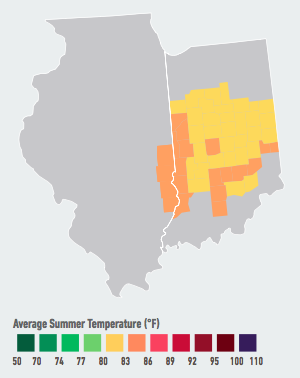
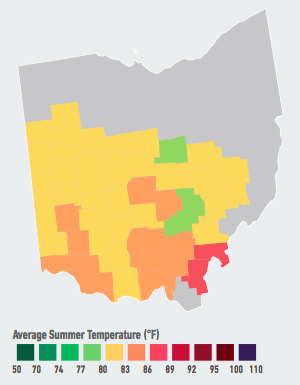
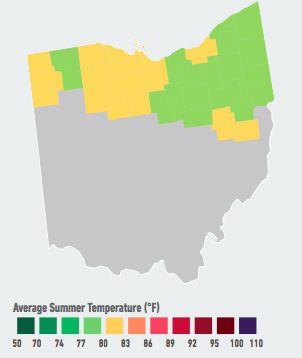
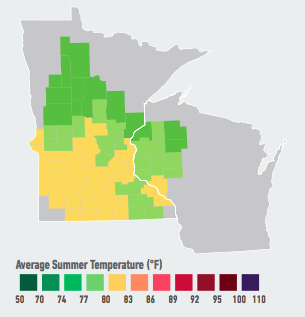
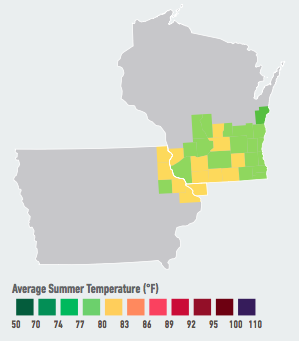
    • Summer average temperatures in Minnesota, Wisconsin, and Ohio are expected to be hotter by century’s end than average summer temperatures in Washington, D.C., today.
    • The average Chicago resident is expected to experience more days over 95°F each year by century’s end than the average Texan does today, with a 1-in-20 chance that these extremely hot days will be more than double Texas’s average.
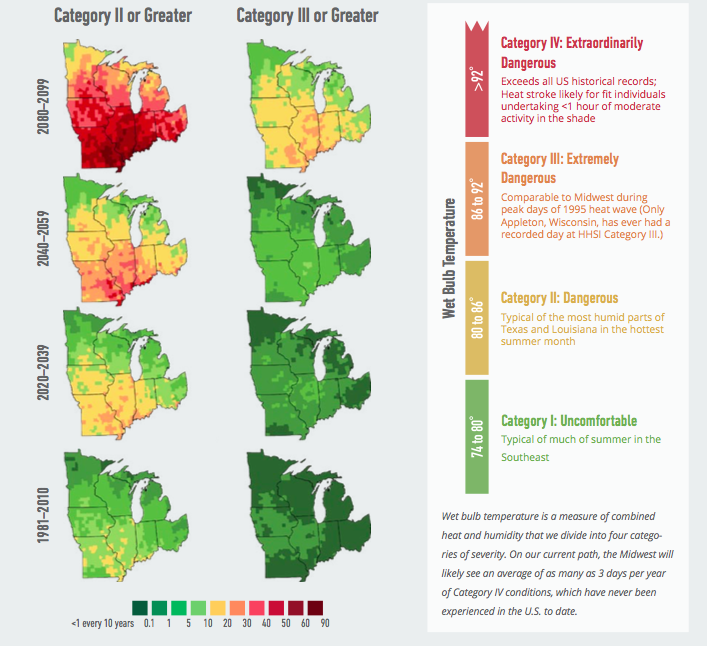
    • Rising humidity combined with increased heat across the region will likely mean more frequent days that reach extremes on the “Humid Heat Stroke Index.”6 There is a 1-in-20 chance that the city of Chicago will experience more than 10 days per year by the middle of this century with heat and humidity conditions similar to the heat wave of 1995, which caused approximately 750 deaths.
  • Northern Midwest states may see fewer deaths as winters warm—but also fewer fish, and less winter recreation.
    • By the end of this century, only two upper Midwest states (Minnesota and Wisconsin) are expected to have average winter temperatures below the freezing mark.
    • By mid-century, the average Midwesterner will likely experience 16 to 37 fewer days below freezing each year (with a 1-in-20 chance of more than 52 fewer days); by the end of the century, there will likely be 40 to 72 fewer days below freezing (with a 1-in-20 chance of more than 88 fewer days).
    • Fewer freezing days translates into less energy used for heating and fewer cold-related deaths; however, warmer winters will also lead to decreased snow and ice for outdoor winter sports like hockey, snowmobiling, and ice-fishing. These winter tourism industries employ over 35,000 workers in the Midwest region.7
    • As streams and lakes become warmer, fish and other sensitive water-based species may be threatened.8

Figure 1. Average Days Over 95°F: A Departure from the Norm. Data Source: American Climate Prospectus.

Average Days Over 95°F: A Departure from the Norm. Data Source: American Climate Prospectus.
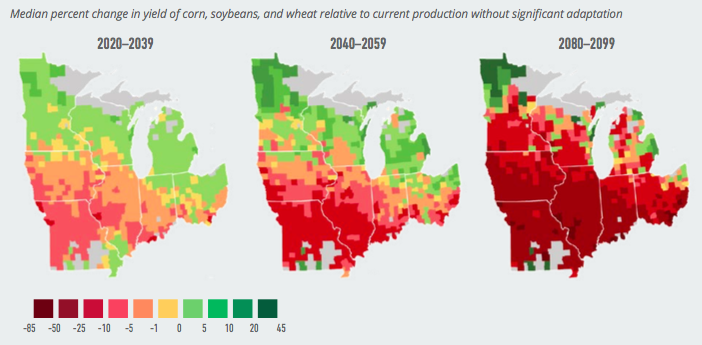
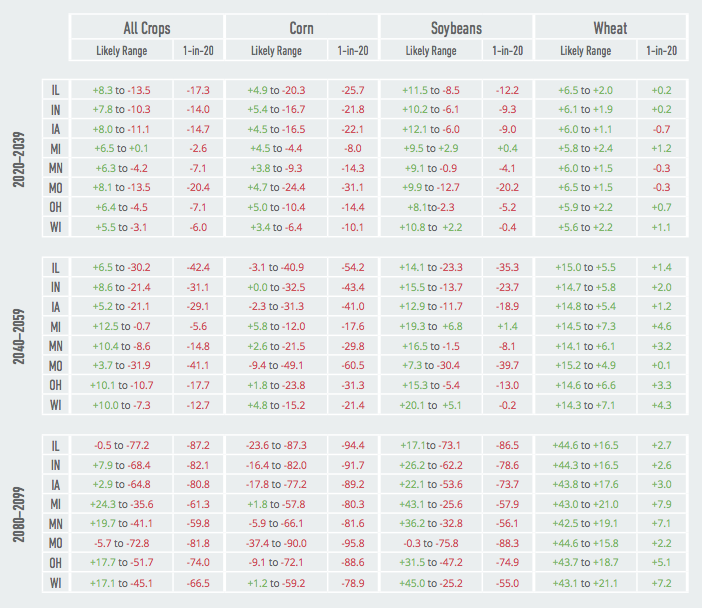
  • Changes in temperature and precipitation will shift agricultural patterns and affect crop yields, with gains in certain crops offset by losses in others.
    • Over the next 5 to 25 years, without significant adaptation by farmers, some counties in Missouri, Illinois, and Indiana will likely see average commodity crop losses up to 18 to 24% due extreme heat each year.
    • On the other hand, warmer winters may extend growing seasons in Minnesota, Wisconsin, and Michigan, allowing farmers to practice double-cropping.
    • If we continue on our current emissions path without significant adaptation, by the end of the century the Midwest will likely see overall agricultural losses for corn and wheat of 11% to 69% across the region as a whole, with a 1-in-20 chance of more than an 80% decline.
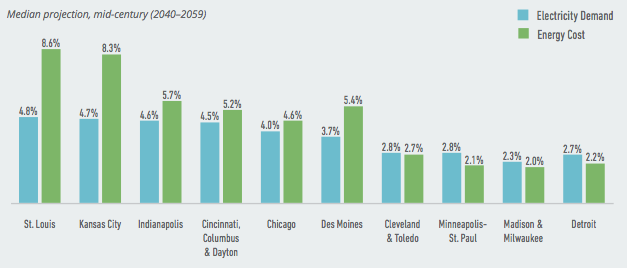
  • Increased heat will raise electricity demand while decreasing energy system capacity, leading to higher energy costs particularly in the manufacturing-intensive southern states.
    • The Midwest region is energy- and emission-intensive, due to the prevalence of energy-intensive manufacturing, substantial dependence on coal-fired power, and emissions from mining and agriculture. As a result, energy use per dollar of GDP in this region is more than 20% higher than the national average, and per capita greenhouse gas emissions are 22% above the national average.9
    • Electricity demand will grow as households and businesses increase their use of air conditioning in response to temperature increases throughout the region. The Midwest in particular will see large energy cost increases due to expenditures associated with switching from heating demand to cooling demand. For instance, the most southern Midwest state of Missouri will likely see a 4% to 16% jump in energy costs by mid-century, with a 1-in-20 chance this jump will be more than 20% by mid-century.
    • Precipitation will likely become more extreme. While it’s difficult to predict future rain and snowfall, climate change is likely to increase the incidence of extreme rainfall events across the Midwest, leading to flooding and related property and crop losses.
    • The timing of rainfall across this region may also shift, affecting growing seasons for farmers and putting additional strain on already-taxed stormwater management and wastewater treatment infrastructure.
  • Rising temperatures will reduce labor productivity while increasing crime rates and heat-related mortality.
    • When heat rises past human comfort levels, labor productivity declines, particularly in “high-risk” industries involving outdoor work (these include construction, transportation, agriculture, and manufacturing).
    • By the end of the century, the St. Louis, Missouri, metro area will likely see labor productivity declines of as much as 3.3% in these high-risk industries, which is comparable to the decline in absolute labor output during past U.S. recessions.10 In St. Louis, there is a 1-in-20 chance of declines in labor productivity of more than 4.6% by end of century.
    • Rising heat will likely cause increased heat-related mortality in the southern states. For example, the Kansas City metro area will likely experience as many as 24 likely additional deaths per 100,000 residents by the end of the century, with a 1-in-20 chance of more than 36 additional deaths per 100,000 residents.
    • Rising heat is also one factor in higher violent crime rates, with as much as a 6.4% increase in crime likely (and a 1-in-20 chance of more than a 8.1% increase) in the Minneapolis-St. Paul metro area by the end of the century.
    • At the same time, northern states will likely benefit from reduced cold-related mortality.

Introduction

Midwesterners understand climate extremes and the risk of venturing into new economic activities in the face of these extremes. Their ability to evaluate these risks—to take calculated plunges into new ventures and economic directions and to innovate and adapt constantly to bring down those risks—has contributed immensely to the region’s preeminence in the national economy, particularly in the agricultural and manufacturing sectors.

The Risky Business Project applies risk assessment to the critical issue of climate change and takes a sober, fact-based look at the potential risks facing specific sectors and regions of the national economy. As in a classic business risk assessment, we analyze not only the most likely scenarios, but also the scenarios that, while less likely, could have more significant impacts.

In this report, we focus on the Midwest region of the U.S. and come to a stark conclusion: The Midwest economy faces multiple and significant risks from climate change. Climate conditions vary dramatically across this region, as does the mix of economic activity. Those variations will benefit the overall region’s economic resilience to future climatic changes; however, each state and metro area within the Midwest has a different risk profile and a different ability to manage that risk.

Given the range and extent of these climate risks, it is clear that staying on our current greenhouse gas emissions pathway will only increase the Midwest’s exposure. The U.S. climate is paying the price today for business decisions made many years ago, especially through increased storm damage and more extreme heat in parts of the country. Every year that goes by without a comprehensive public and private sector response to climate change is a year that locks in future climate events that will have a far more devastating effect on our local, regional, and national economies. Moreover, both government and the private sector are making investment decisions today—whether in property, infrastructure, or regional and national supply chains—that will be directly affected by climate change in decades to come.

On the other hand, if both the government and private sector act now to reduce emissions, the U.S. can significantly reduce the odds of costly climate outcomes. Midwest business and policy leaders can play a critical role in modeling strong climate resilience and emissions reductions, and in pushing the U.S. into a global leadership position on climate change.

Figure 2. Human society is structured around “normal” weather, with some days hotter than average and some colder. At the distant “tails” are extreme events such as catastrophic weather. Climate change shifts the entire distribution curve to the right: old extremes become the new normal, new extremes emerge, and the process continues until we take action. Source: Risky Business Project.

Human society is structured around “normal” weather, with some days hotter than average and some colder. At the distant “tails” are extreme events such as catastrophic weather. Climate change shifts the entire distribution curve to the right: old extremes become the new normal, new extremes emerge, and the process continues until we take action. Source: Risky Business Project.

How Extreme Weather Events Become the New Normal

The Risky Business Project does not dictate the solutions to climate change; while we fully believe the U.S. can respond to these risks through climate preparedness and mitigation, we do not argue for a specific set or combination of these policies. Rather, we document the risks and leave it to decision-makers in the business and policy communities to determine their own tolerance for, and specific reactions to, those risks.

As with any risk assessment, this investigation into the risks of climate change to the Midwest looks at not only the most likely outcomes, but also at climate futures that have a lower probability of occurring but particularly severe consequences should they come to pass. (See “Defining Risk”). This focus on “tail risks” is not unique to climate change. After all, households and businesses pay a premium for insurance to protect themselves against those tail risks, such as the possibility of flood or fire, that they deem unacceptable. The military plans for a wide range of possible (and sometimes highly unlikely) conflict scenarios, and public health officials prepare for pandemics of low or unknown probability.

When looking at climate change, it’s particularly important to consider the outlier events and not just the most likely scenarios. Indeed, the “outlier” 1-in-100 year event today will become the 1-in-10 year event as the Earth continues to warm. Put another way, over time the extremes will become the “new normal.”

Defining Risk

The risk of a future event can be described as the probability (or likelihood) of that event combined with the severity of its consequences. The combination of likelihood and severity determines whether a risk is high or low. For instance, a highly likely event with minimal consequences would register as a moderate risk; a low probability event, if it has potentially catastrophic impacts, could constitute a significant risk. These low-probability/high-impact risks are generally referred to as “tail risks.”

The Risky Business assessment evaluates a range of economic risks presented by climate change in the U.S., including both those outcomes considered most likely to occur and lower probability climate futures that would be either considerably better or considerably worse than the likely range. This is a common risk assessment approach in other areas with potentially catastrophic outcomes, including disaster management, public health, defense planning, and terrorism prevention.

In presenting our results, we use the term “likely” to describe outcomes with at least a 67% (or 2-in-3) chance of occurring. In discussing notable tail risks, we generally describe results as having a 1-in-20 chance (or 5%) of being worse than (or better than) a particular threshold. All risks described in this report represent average annual outcomes over one of three 20-year time periods: near term (2020–2039), mid-century (2040–2059) and end of century or late century (2080–2099).

Another characteristic of a classic risk assessment is that it does not take into account the huge range of potential adaptation strategies the region’s industries and policymakers will pursue in the face of shifting climate impacts. These potential responses are frankly too varied and too speculative to model with any certainty. Rather, we present our estimate of the risks the Midwest will face if it maintains its current economic and demographic structure, and if businesses and individuals continue to respond to changes in temperature and precipitation as they have in the past.

Results: General Regional Trends

If you do not change direction, you may end up where you are heading.

Lao Tau

The Midwestern United States faces diverse and significant risks from unabated climate change. These risks vary across the region, which includes some states bordering the Southeast, like Missouri, and other far northern states like Wisconsin and Minnesota. As a result, there is no single top-line number that represents the cost of climate change to the Midwest economy as a whole. For this reason, we have broken down the region into its ten major metropolitan areas, which contain 80% of the population of the region and represent over 80% of its GDP.11 We go into specific detail on each area’s likely climate risks and costs in the next section.

Despite this regional variability, there are some generalizations we can make about the Midwest’s reaction to a changing climate. These include:

  • Increasing heat. Overall, residents of the region will likely see between two and five times more days over 95°F in a typical year in the next 5 to 25 years than they have over the past 30 years. The more southern Midwest states will see the most dramatic increase in these extremely hot days—the average citizen in the Chicago area is expected to experience more days over 95°F than the average Texan does today, with a 1-in-20 chance of more than double the average number of hot days currently experienced each year in Texas. However, their northern neighbors will experience increased heat as well. This may manifest in the form of warmer winters rather than much hotter summers; of the seven states that currently have sub-freezing average winter temperatures, only two (Wisconsin and Minnesota) are still expected to do so if we continue on our current emissions pathway through the end of the century.
  • Increasing humidity and the “Humid Heat Stroke Index.” As Midwesterners well know, it’s not just the heat, it’s the humidity—or, in this case, a dangerous combination of the two. One of the most striking findings in our analysis is that increasing heat and humidity in some parts of the region could lead to outside conditions that are literally unbearable to humans, who must maintain a skin temperature below 100°F in order to effectively cool down and avoid fatal heat stroke. The Midwest has never yet seen a day exceeding this combination of heat and humidity, which we measure as Category IV HHSI along a “Humid Heat Stroke Index” (see Figure 4)—though Appleton, Wisconsin came very close in 2005 when a combination of an outside temperature of 101°F and dew point of 90°F led to a Category III HHSI day. Our research shows that if we continue on our current path, the average Midwesterner will likely see up to three days at the extraordinarily dangerous Category IV HHSI every year (with a 1-in-20 chance of more than 9 days), and as many as 25 days at Category III HHSI (with a 1-in-20 chance of more than 38 days), by the end of this century.

    Figure 3. Changing Summer Temperatures By State. Data Source: American Climate Prospectus.

    Changing Summer Temperatures By State. Data Source: American Climate Prospectus.
  • Changes in precipitation. In general, precipitation changes due to climate change are much harder to predict than heat impacts. However, if we stay on our current path, average annual precipitation across the Midwest will likely increase over the course of the century, compared to the past three decades. But looking only at annual averages across the region can mask differences in seasonal or local precipitation patterns, which directly affect rain- or snow-dependent industries such as agriculture and tourism. Precipitation increases are most probable in the spring, when most Midwestern states will very likely get wetter. In fall and winter, precipitation levels will also likely increase across the region, while summer will bring likely decreases in precipitation to Iowa and Wisconsin and mixed impacts to other states. These variations will have measurable impacts on the lake levels in the Great Lakes and the Mississippi River, which are core to the region’s economy and culture.


  • Economic impacts of heat, humidity, and precipitation changes on agriculture, energy, health, crime, and labor productivity. Increased heat and humidity and variations in precipitation will have a significant impact on the Midwest economy as a whole and on particular sectors such as energy and agriculture. Because these impacts vary so greatly across the region, we discuss them by metro area below, as well as in a special chapter on climate risk to the Midwest agriculture sector.

Figure 4. Mean number of days in a typical Midwest summer when the temperature and humidity could reach HHSI category II, III, or even greater. These are days when the heat and humidity could be so high that it will be dangerous for humans to remain outdoors. Data Source: American Climate Prospectus.

Mean number of days in a typical Midwest summer when the temperature and humidity could reach HHSI category II, III, or even greater. These are days when the heat and humidity could be so high that it will be dangerous for humans to remain outdoors. Data Source: American Climate Prospectus.

Humid Heat Stroke Index

A changing climate will present new risks and new opportunities as we face the complex task of producing enough food, feed and fuel for a world on its way to 9 billion people. Given the importance of the Midwestern United States to the world’s agricultural production, it would be irresponsible to dismiss these projections lightly.

Gregory Page — Former CEO and current Chair of the Board of Cargill, Inc.

Midwest Agriculture & Climate Risk

The upper Midwest economy is dominated by commodity agriculture, with some of the most productive corn and soybean growing in the world. The agricultural industry in this region includes more than 520,000 farms valued at $135.6 billion per year as of 2012, and the Midwest accounts for 65% of national production of corn and soybeans alone.12 As a result, crop and livestock production is a crucial business whose success or failure also determines basic economic conditions in many rural communities.

The health and productivity of the agricultural sector is inextricably intertwined with climate conditions. Our research focused on two specific climate impacts— changes in heat and precipitation—and their interaction with the three major commodity crops found in the Midwest, as well as their impact on livestock production and the effectiveness of the agricultural labor force. In examining climate-related crop impacts, we also took into account the fertilization that occurs at higher carbon dioxide (CO2) concentrations in the atmosphere.

As in a classic risk assessment, we did not model potential future adaptation into this analysis—that is, we assumed that growing seasons would be the same as they are now and did not account for specific adaptation measures, such as introducing irrigation in areas that have not traditionally had to rely on this practice. Farmers are generally very quick to adapt to changing climate conditions; however, some adaptive measures may be prohibitively costly or otherwise constrained by other climate change effects that our research did not take into account. For instance, climate change may lead to decreased water supplies in certain regions, limiting the availability of water for irrigation. This type of impact would be especially significant in the Midwest, which relies heavily on rain and consistent ground water supplies for crop irrigation.

Overall, our research shows that the Midwest region faces significant climate risks to its agricultural sector if we stay on our current greenhouse gas emissions pathway, but that these risks vary markedly by state, county, and even specific crop.

The most direct climate impact on Midwest agriculture is due to the likely increases in heat across the region. Plant growth is highly dependent on temperature:
Each crop species has a unique temperature threshold that defines its temperature range for optimal growth, outside of which crop yields can drop dramatically. The current distribution of crops across the nation generally reflects these thresholds, so small increases in temperature can lead to production declines, absent significant crop adaptation.

Figure 5. Current Crop Distribution: Corn, Soybeans & Wheat. Data Source: U.S. Department of Agriculture, National Agricultural Statistics Service.

Current Crop Distribution: Corn, Soybeans & Wheat. Data Source: U.S. Department of Agriculture, National Agricultural Statistics Service.

Take corn, for example: The corn crop is strongly heat sensitive and responds less to the beneficial impacts of carbon fertilization than do wheat or soybeans. As a result, the lower half of the Midwest region—the states of Missouri, Illinois, Indiana, and Iowa—will likely suffer significant corn yield losses by mid-century absent adaptation. The upper Midwest states face mixed outcomes: Both increases and decreases are within the range of likely possibilities, and even these states face a 1-in-20 possibility of significant corn yield declines (for example, more than 30% losses in Minnesota by mid-century).

The region’s wheat crop, on the other hand, seems more resistant to the heat, perhaps because the majority is winter wheat, grown in the cooler months.13 Of all the crops we analyzed, wheat seems the most resistant to major yield declines as a result of rising temperatures from climate change. However, of all the commodity crops we analyzed, wheat is currently grown the least intensively in the Midwest region as we have defined it (See Figure 5).

Figure 6. Projected Change in Corn, Soybeans, and Wheat Yields. Data Source: American Climate Prospectus.

Projected Change in Corn, Soybeans, and Wheat Yields. Data Source: American Climate Prospectus.

As a result of these variations in crop resistance to extreme heat, as well as in the levels of extreme heat likely to affect different parts of the Midwest region, there is no single story to tell about the impact of climate change on Midwest agriculture. In general, the Midwest states with the greatest increases in extremely hot days will likely also see the greatest declines in crop yields, with the most significant impacts on the corn crop. Missouri, the southernmost state in this region, will be the hardest hit with likely annual losses in corn yields of up to 24% over the next 5 to 25 years on average and likely losses of 37% to 90% by the end of the century. Illinois is a close second, with likely losses in corn yields up to 20% in the short term.

Further north, the states of Minnesota and Wisconsin will likely see warmer summers, fewer extremely cold days, and increased CO2 in the atmosphere due to the same emissions that cause climate change. As a result, these states will likely experience yield increases in some crops—though even they will see yield declines in the “tail risk.” For example, Minnesota will see a likely increase of up to 17% in soybean yields by 2040–2059, with a 1-in-20 chance of an 8% decrease. However, our research did not take into account possible negative byproducts of warmer winters, such as the potential for some insect species to live through the winter. Warmer winters will also extend the geographic distribution of weeds northward, exposing farms in northern latitudes to new or enhanced threats to productivity. This can increase the cost of weed control, which already has an $11 billion price tag per year in the U.S. alone, mostly for herbicides such as glyphosate (also known as RoundUpTM), to which some weeds have demonstrated increased tolerance at higher CO2 levels.14 Moreover, many invasive species, both plant and insect, may actually benefit more than crops from the increased CO2 and temperatures brought about by climate change, though the relative effect of these factors on crop-weed competition is likely to be species-specific.15

It is important to note that heat doesn’t only affect crop production; it also has a direct influence on livestock productivity. For many livestock species, increased body temperatures of 4°F to 5°F above optimum levels can disrupt performance, production, and fertility, limiting an animal’s ability to produce meat, milk, or eggs. Higher temperatures can also increase animal mortality. In addition, climate change can affect the price and availability of water, feed grains, and pasture, and change patterns of animal diseases. Finally, any negative impact on crop productivity, especially for corn and soybeans, will increase feed costs for livestock producers, putting additional pressure on that sector.

Simple crop and livestock impacts don’t tell the full story of the impact of climate change on the Midwest agricultural sector. There is also the question of the role that these commodities play in the overall economy of particular states. Iowa has by far the highest percent of its state economy dependent on commodity agriculture of any of the states in this region; as a result, the economic output losses from commodity crop declines in Iowa are high (likely $850 million to $12 billion per year by century’s end) even though yield declines aren’t as high in this state as in some others. Illinois faces even higher potential economic costs from climate-related yield losses. By 2020–2039, likely impacts to the state economy span gains ($1.1 billion per year) to losses ($2.6 billion per year, with a 1-in-20 chance of more than $3.4 billion in losses) due to the potential for economic gains from increases in yields. However, given that corn and soybeans are the top two crops grown in the state, overall likely losses are larger than gains. In the long term, the likely impacts to the state economy are exclusively losses: Illinois stands to lose $1.5 to $13 billion per year from crop losses by the end of the century.

One risk from climate change that is not often discussed in the agricultural sector is the impact rising temperatures will have on labor productivity. Economists consider agriculture a “high-risk” industry in that many of the workers in this sector are outdoors for long stretches of the day, even with the advent of air-conditioned farm equipment. Other industries closely tied to agriculture, such as transportation and manufacturing (including food processing) are also considered high-risk. As heat rises past human comfort levels, labor productivity falls, and some states in this region will see likely labor productivity declines across all high-risk sectors by as much as 3% by the end of this century. In Missouri, there is a 1-in-20 chance the decline could reach as high as 4.2%—a decline comparable to the decline in absolute labor output during past U.S. recessions.16

Figure 7. Percent change in yield of corn, soybeans, and wheat is relative to current production, without adaptation by farmers. “All crops” is the sum of the impacts to corn, soybeans, and wheat in each state weighted by the amount of each crop that is currently grown in that state. Data Source: American Climate Prospectus.

Percent change in yield of corn, soybeans, and wheat is relative to current production, without adaptation by farmers. “All crops” is the sum of the impacts to corn, soybeans, and wheat in each state weighted by the amount of each crop that is currently grown in that state. Data Source: American Climate Prospectus.

Projected Change in Crop Yields by State and Probability

There is little doubt that the Midwest agricultural industry will face significant and varied risks from climate change through this century, but this sector is also one of the best equipped to manage these risks. Farmers have always adapted to changing weather and climate conditions, with adaptation and flexibility built into their business models. Armed with the right information, Midwest farmers can, and will, mitigate some of these impacts through double-cropping, seed modification, crop switching, and other adaptive practices. In many cases, crop production will likely shift from the Midwest to the Upper Great Plains, Northwest, and Canada, helping to keep the U.S. and global food system well supplied. However, this shift could put individual Midwest farmers and rural communities at risk if production moves to cooler climates.

Luckily, many of the strategies the agricultural sector can use to adapt to climate risk and increase resilience to climate change can actually save producers money in the short term. This is particularly worthwhile to consider at a time when commodity prices are retreating from the record highs experienced in 2010–2013. Conducting energy audits for farms and agribusinesses, for example, provides an inexpensive way for producers to identify energy savings on lighting, HVAC, farm equipment, and processes that both reduce overhead costs and reduce the farm’s carbon footprint. Other factors, such as nutrient management to optimize fertilizer use and reduce emissions from excess fertilizer, can also increase the bottom line while taking steps to reverse the impact of climate change.

Food systems are resilient at a regional, national, and global level, and agricultural producers have proven themselves extremely able to adapt to changing climate conditions. But these shifts can carry risks for the individual farming communities most vulnerable to projected climatic changes. As interest grows in strategies to boost climate resiliency, policymakers and agricultural business leaders will need to place a greater emphasis on helping growers put new technology and methods to use that can help maintain current productivity levels while boosting resilience to climate change in the long term.

Results by Metro Area

While the Midwest region of the United States can be characterized by its distinct location, culture, and outsized economic impact on national and global agriculture and manufacturing, the region is far from monolithic. To recognize the diverse nature of this region, especially in terms of climate impacts, we have pulled out the ten metro areas of the Midwest for individual analysis.

Figure 8. The 10 metro region clusters (blue) are based on the U.S. Department of Commerce’s “cluster mapping” project and encompass the relevant regional markets surrounding the metro areas. Data Source: Rhodium Group.

The 10 metro region clusters (blue) are based on the U.S. Department of Commerce’s “cluster mapping” project and encompass the relevant regional markets surrounding the metro areas. Data Source: Rhodium Group.

Midwest Metro Areas

Over 80% of the region’s residents live in these broader metro areas, which are based on the definitions that are used in the U.S. Department of Commerce’s “cluster mapping” project. This project organizes the country into “regional concentrations of related industries”17 formed around cities and their surrounding suburbs, or sometimes on aggregations of multiple metro areas. The clusters are based on relevant regional markets surrounding metro areas and therefore cross state borders in some instances (e.g. the Minneapolis-St. Paul metro area, which extends into Wisconsin, or the St. Louis metro area, which extends into Illinois).

Though the region’s economic activity tends to be concentrated in these metro areas, none of them operates in a vacuum. Several—e.g., St. Louis, Kansas City, Chicago, and Detroit—are major transportation hubs, connecting Midwest industries to the rest of the nation via rail, port, and highway. Chicago and Minneapolis are large global cities, home to international commodities markets and multinational companies. And the entire Midwest region supplies the nation and the globe with key agricultural and manufactured products, from corn and soybeans to auto parts and solar panels.

St. Louis

With a metro area population of over 3.3 million,18 the St. Louis cluster—spanning parts of both Missouri and Illinois—is one of the largest in the Midwest. While its specific climate risks are significant, the metro area is also highly interconnected with the rest of the region and the country: St. Louis boasts the third-busiest inland port in the U.S. (along the Mississippi River) as well as the third-largest railroad hub, and is the headquarters of nine Fortune 500 companies. As a result, climate impacts felt here may reverberate across national trade routes and supply chains. Overall, the city’s main economic drivers are service, manufacturing, trade, and transportation.

St. Louis – Average Summer Temperture By End Of Century. On our current emissions path, residents of St. Louis will see the average number of days over 95°F per year likely double to quadruple within the next 5 to 25 years. The largest increases in electricity consumption will also occur in St. Louis, resulting in a 4 to 15% likely increase in energy costs by mid-century. Data Source: American Climate Prospectus.

On our current emissions path, residents of St. Louis will see the average number of days over 95°F per year likely double to quadruple within the next 5 to 25 years. The largest increases in electricity consumption will also occur in St. Louis, resulting in a 4 to 15% likely increase in energy costs by mid-century. Data Source: American Climate Prospectus.

Of all the metro areas we assessed, the St. Louis area is likely to face the most severe climate risks. It has the second highest summer average temperatures of all Midwestern metro areas, as well as some of the highest humidity levels. Over the past 30 years, St. Louis has experienced only about 8 days over 95°F each year on average. If we continue on our current path, it will see a likely increase to 16 to 35 extremely hot days on average in the near term, and 49 to 126 extremely hot days by end of century. The extreme tail risk is even more significant: There is a 1-in-20 chance the area will experience more than 43 extremely hot days over the next 5 to 25 years, and more than 135 days (more than four full months) by late century. These are the highest likely increases in extremely hot days of any metro area we studied.

The St. Louis metro area is already humid, as its residents know all too well. To date the area has never experienced a combination of heat and humidity reaching critical levels on what we call the “Humid Heat Stroke Index,” where combined temperatures and dew point can reach fatal levels for anyone spending significant time outdoors. By the end of this century, however, St. Louis will likely see 5 to 40 days at Humid Heat Stroke Index Category III (with a 1-in-20 chance of more than 48 days), a level at which core body temperatures can reach as high as 104°F.

Extreme heat has significant impacts on energy demand, labor productivity, heat-related mortality, and even violent crime. Major St. Louis findings include:

  • Rising energy costs: For a city dependent on its trade, transportation, and manufacturing, energy costs are a critical economic factor. If we continue on our current path, St. Louis will experience a likely increase of 3 to 8% in electricity demand by mid-century and 8 to 20% likely by end of century. When combined with reductions in heating demand due to warmer winters, that translates into a likely increase of 4 to 15% in energy costs by mid-century and up to 37% by late century, with a 1-in- 20 chance of cost increases of more than 46%.
  • Declines in labor productivity: Rising temperatures will likely depress labor productivity in high-risk occupations, including transportation, manufacturing, and utilities. St. Louis risks the highest labor productivity decline of all the metro regions we studied, with a likely decline of up to 3.3% (with a 1-in-20 chance of more than 4.6%) in high-risk industries by end of century.
  • Heat-related mortality: Even without added humidity, rising temperatures stress the body and can lead to heat stroke and other fatal consequences. If we continue on our current emissions path, St. Louis will experience a likely increase of 7 to 37 additional deaths per 100,000 people by century’s end—at the high end, that’s about three times the number of people who died in fatal car crashes in Missouri in 2010.19
  • Increases in violent crime: Finally, one of the strongest connections that we found in our research is between rising temperatures—both summer and winter—and violent crime. St. Louis, which already has the third-highest homicide rate of any major city, will see a likely increase of up to 5% (with a 1-in-20 chance of more than 6.6%) in all violent crime by end of century due to the higher incidence of extremely hot days as a result of climate change.

Climate and Crime

According to the Federal Bureau of Investigation, many factors influence crime rates including population density, age, education, family cohesiveness, and divorce rates, effectiveness of law enforcement, and weather. While climate is not the primary cause of crime, studies find clear evidence that climate variations can have substantial effects on both violent and non-violent crime even when controlling for all other possible explanations. The evidence is particularly strong for one climate variable: temperature. Increased temperature may affect crime directly, by increasing aggression levels; or indirectly, by increasing social interaction due to warmer winter weather, which expands opportunities for crime to occur.20

Kansas City

Like St. Louis, Kansas City is a major transportation hub, and it is a key distribution stop along the Missouri River. More than 70,000 people are employed in distribution and electronic commerce in the greater Kansas City metro area, which is home to over 2.6 million people. Other important industries include livestock processing and manufacturing.

Kansas City – Average Summer Temperature By End Of Century. On our current emissions path, residents of Kansas City (who already experience the highest average summer temperatures in the Midwest) will see the average number of days over 95°F per year likely double to triple within the next 5 to 25 years. This major transportation hub will also experience large increases in electricity consumption, resulting in a 4% to 16% likely increase in energy costs by mid-century. Data Source: American Climate Prospectus.

On our current emissions path, residents of Kansas City (who already experience the highest average summer temperatures in the Midwest) will see the average number of days over 95°F per year likely double to triple within the next 5 to 25 years. This major transportation hub will also experience large increases in electricity consumption, resulting in a 4% to 16% likely increase in energy costs by mid-century. Data Source: American Climate Prospectus.

Kansas City is also an important hub for agricultural products and therefore disproportionately affected by likely changes to the agricultural health of the broader Midwest region. In particular, the Kansas City Board of Trade is the principal trade exchange for hard red winter wheat.

Of all the Midwest metro areas we studied, Kansas City has had the highest average number of days over 95°F over the past 30 years, at around 10 each year on average. These extremely hot days will only increase if we stay on our current emissions path, with a likely increase of 16 to 29 extremely hot days on average over the next 5 to 25 years, a likely jump of 21 to 51 such days by mid-century, and 46 to 105 extremely hot days likely by the end of this century. At the same time, humidity will likely push the city toward as many as 23 days at HHSI Category III by the end of the century, with a 1-in-20 chance of more than 30 days per year at this level. To date, the metro region has never experienced this extreme combination of heat and humidity.

The rising heat in Kansas City will pose significant climate risks to this metro area. These include:

  • Rising energy costs: The Kansas City metro area could see a likely increase of 8 to 19% in electricity demand (with a 1-in-20 chance of an increase over 23%) by end of century, even when combined with lower heating demand as winters become warmer, translating into a likely increase of 14% to 38% in energy costs, with a 1-in-20 chance of increases of more than 48%—the highest energy cost increase of any Midwest metro area. For a city shaped by energy-intensive industries such as food processing, transportation, and manufacturing, these increases are significant.
  • Decline in labor productivity: Those same energy-intensive industries may also include a labor force that must spend hours outside in hot and humid conditions. Labor productivity in these high-risk industries will see a likely decline by as much as 2.9% by the end of this century, translating into a major economic hit to the metro region—especially when considering the 1-in-20 chance that labor productivity will decline by more than 3.7%.
  • Mortality and violent crime: As elsewhere in the region, rising heat translates into additional heat-related mortality and increases in violent crime, with likely increases of 3 to 24 additional deaths per 100,000 residents and a likely increase of 5.3% in violent crime due solely to hotter temperatures by the end of this century.

Climate Change and the Mississippi

The Mississippi River serves as a vital artery for commerce in the region and surrounding areas, transporting roughly $180 billion in freight along its waters each year.21 Nearly 60% of the nation’s grain exports move along this corridor, along with major quantities of coal and steel.

While we cannot say with certainty the exact contribution of climate change to any individual flood or drought, we know that rising greenhouse gas emissions increase the likelihood for changes in precipitation that lead to drought conditions.

In particular, increased variation in the amount of precipitation falling on this region has the potential to wreak havoc on waterway commerce along the Mississippi and Missouri Rivers and across the Great Lakes. Heavy precipitation can lead to very high water levels along rivers with faster flow rates, making navigation increasingly difficult and also leading to floods, especially given the poor condition of almost 4,000 miles of levees in the Midwest.22 In 2011, for example, severe flooding delayed barge traffic, caused barges to run lighter loads, and forced some cargo to be re-routed to trucks and rail.23 Subsequent delays are expensive and can have ripple effects throughout the economy, affecting supply chains and commodity prices.

Although specific flooding incidents can not necessarily be attributed to climate change, projected increases in precipitation indicate that such events will likely become more frequent in the future.

On the other hand, decreased summer precipitation combined with longer dry spells could lower water levels along the region’s rivers and lakes. The 2012 drought provides an example of the kind of economic harm that can result from severe drought along the Mississippi: that year, severe drought in the upper Midwest left Mississippi River levels at near-record lows, slowing river traffic and goods transport along the nation’s busiest waterway. As a result, tugs pulled fewer barges, and barge operators reduced loads to avoid bottoming out.

Disruptions in barge traffic come with a significant price tag for both business and government: every inch drop in water level corresponds to more than 250 fewer tons of barge capacity along the river,24 and ultimately barge cargo totals for December 2012 totaled 1.1 million metric tons less than December 2011 levels.25 Meanwhile, the Army Corps of Engineers continually dredged portions of the river to ensure they remained passable throughout this period.

Indianapolis

Indianapolis, with a population of over 3.4 million in its broader metropolitan area, is probably best known to non-residents for the Indy 500. But the city is another kind of transportation center as well: With roads leading out of the city in all directions, Indianapolis is a major regional transportation hub connecting to Chicago, Louisville, Cincinnati, Columbus, Detroit, Cleveland, and St. Louis. As a result, “The Crossroads of America” is highly interconnected with the rest of the Midwest as well as the Southeastern United States.

Indianapolis – Average Summer Temperature By End Of Century. On our current path, residents of Indianapolis will see the average number of days over 95°F per year increase from 2 over the past 30 years to 3 to 13 likely within the next 5 to 25 years. Higher temperatures will likely raise electricity demand and energy costs, decrease labor productivity, and increase heat-related mortality and violent crime over the course of the century. Data Source: American Climate Prospectus.

On our current path, residents of Indianapolis will see the average number of days over 95°F per year increase from 2 over the past 30 years to 3 to 13 likely within the next 5 to 25 years. Higher temperatures will likely raise electricity demand and energy costs, decrease labor productivity, and increase heat-related mortality and violent crime over the course of the century. Data Source: American Climate Prospectus.

Similar to its southern Midwest neighbors, Indianapolis will likely experience significant increases in extremely hot days as a result of climate change, so long as we stay on our current emissions pathway. The area’s current 30-year average for days over 95°F is roughly 2 days per year, but this will likely increase to 3 to 13 days per year on average over the next 5 to 25 years, 8 to 30 extremely hot days likely by mid-century, and 21 to 92 days—more than 3 months—of extremely hot days by the end of this century. The tail risk is more significant:

There is a 1-in-20 chance of more than 17 extremely hot days in the near term, 38 days by mid-century, and 114 days by the century’s end.

These higher temperatures mean Indianapolis will see a likely increase of up to 15 additional deaths per 100,000 residents by late century, with a 1-in-20 chance of more than 31 additional deaths. At the same time, this metro area will likely see up to 33 days of HHSI Category III days (with a tail risk of more than 45 days) by the end of the century, a level of dangerous heat and humidity the Indianapolis metro region has never before experienced.

Other important likely climate risks to Indianapolis include:

  • Rising energy costs: Indianapolis could see a likely increase of 7% to 17% in electricity demand. Even when combined with reduced heating demand from warmer winters, this translates into an 8% to 23% likely increase in energy costs by late century and a 1-in-20 chance of more than a 31% increase. These likely increased costs could have a serious economic impact on a city known for its distribution systems and energy-intensive industries.
  • Declines in labor productivity: Indianapolis’s high-risk outdoor industries, especially transportation, could be hurt by a likely decline in labor productivity of up to 2.8% (with a tail risk of more than 3.7%) by the end of the century.
  • Violent crime: As in other southern Midwest cities, Indianapolis will likely see an increase in violent crime if we stay on our current emissions pathway. This city is likely to experience up to a 5.8% increase in violent crime due to warmer temperatures by end of century.

Cincinnati, Columbus, and Dayton

The economic cluster of Cincinnati, Columbus, and Dayton, Ohio, with a combined metro population over 6.4 million, is characterized in large part by its focus on manufacturing. Ohio’s borders are within 500 miles of roughly 60% of the entire country’s population and manufacturing infrastructure, and Dayton in particular—due to its location at the intersection of Interstates 70 and 75—is a logistical center for manufacturers, suppliers, and shippers. Dayton is also the home of the Wright-Patterson Air Force Base, which is the research and development arm of the U.S. Air Force; its presence in this region has spurred innovation in industrial, aeronautical, and astronomical engineering. Columbus, meanwhile, is an insurance hub that provides vital support to many Ohio and regional industries, and Cincinnati is a manufacturing center that is home to the headquarters of nine Fortune 500 companies.

Cincinnati, Columbus, & Dayton – Average Summer Temperature By End Of Century. On our current emissions path, residents of Cincinnati, Columbus, and Dayton will see the average number of days over 95°F per year likely increase from 2 over the past 30 years to 5 to 14 likely within the next 5 to 25 years. Higher temperatures will likely raise electricity demand and energy costs, decrease labor productivity, and increase heat-related mortality and violent crime over the course of the century. Data Source: American Climate Prospectus.

On our current emissions path, residents of Cincinnati, Columbus, and Dayton will see the average number of days over 95°F per year likely increase from 2 over the past 30 years to 5 to 14 likely within the next 5 to 25 years. Higher temperatures will likely raise electricity demand and energy costs, decrease labor productivity, and increase heat-related mortality and violent crime over the course of the century. Data Source: American Climate Prospectus.

With its focus on energy-intensive manufacturing, logistics, insurance, and national security, this area is in some ways a perfect storm of industries vulnerable to climate risk. As with the other southern Midwest metro areas, the main climate risk to the Cincinnati/Columbus/Dayton area is from extreme heat. On average over the past 30 years, this area experienced 2 days of over 95°F each year; this number is expected to grow, with 5 to 14 days likely on average over the next 5 to 25 years, 10 to 30 extremely hot days likely by mid-century, and 25 to 90 days likely over 95°F by century-end. There is a tail risk, or 1-in-20 chance, of more than 19 extremely hot days over the near term, 46 days above 95°F by mid-century, and 110 days by the end of the century. In addition, the metro region will likely see 1 to 23 days of HHSI at Category III and a 1-in-20 chance of more than 46 days at this dangerously high level. These heat levels are consistent with the levels reached during Chicago’s famous 1995 heat wave.

Specific economic risks following from these warming conditions include:

  • Rising energy costs: The Cincinnati/Columbus/Dayton area will likely see a 7% to 16% electricity demand increase by the end of the century, with total energy spending likely increasing 8% to 22%, even taking into account reduced heating demand from warmer winters. For a region dependent on manufacturing and logistics, these increased costs come at a high price.
  • Declines in labor productivity: We found in our inaugural Risky Business Project report that over 30% of Ohio’s labor force works in the industries most at risk for declining labor productivity due to climate-related heat—industries such as manufacturing, transportation, agriculture, and utilities. For the Cincinnati/Columbus/ Dayton region, if we stay on our current emissions path, increased heat will likely decrease labor productivity in these high-risk industries by up to 2.6% (with a 1-in-20 tail risk of more than 3.6%) by end of century.
  • Mortality and violent crime: As elsewhere in the region, rising heat translates into additional heat-related mortality and increases in violent crime, with likely additional deaths as high as 16 per 100,000 people and likely increases in violent crime up to 5.4% by the end of the century.

Figure 9. Projected Change in Electricity Demand and Energy Costs by Metro Area. Data Source: American Climate Prospectus.

Projected Change in Electricity Demand and Energy Costs by Metro Area. Data Source: American Climate Prospectus.

Chicago

Chicago is the largest metro area in the Midwest region by far, with an urban population of 2.7 million and a larger metro area population of over 10.4 million. It is also the largest economic engine in the Midwest region, with a Gross Metropolitan Product of over $569 billion— third only to New York City and Los Angeles.

Chicago – Average Summer Temperature By End Of Century. On our current emissions path, residents of Chicago will see the average number of days over 95°F per year likely double to quadruple within the next 5 to 25 years. As a result, the Windy City will likely see among the biggest increases in violent crime due to hotter weather of any metropolitan area studied, among other impacts. Data Source: American Climate Prospectus.

On our current emissions path, residents of Chicago will see the average number of days over 95°F per year likely double to quadruple within the next 5 to 25 years. As a result, the Windy City will likely see among the biggest increases in violent crime due to hotter weather of any metropolitan area studied, among other impacts. Data Source: American Climate Prospectus.

The Chicago metro area is fully interconnected with the rest of the region and with the larger national and global economies. Chicago is an international hub for finance, commerce, industry, technology, telecommunications, and transportation; it boasts the busiest airport in the world, and it is crisscrossed by the largest number of U.S. highways and rail lines of any city in the country. Moreover, the Chicago area is home to a major inland port on Lake Michigan.

Climate risks from increased heat are particularly severe in cities of this size and population density. In Chicago’s case, rising heat levels can have serious consequences. The area has seen an average of 3 days above 95°F per year over the past 30 years, but if we continue on our current emissions pathway, this number will likely rise by 5 to 13 days over the near term, 9 to 30 extremely hot days by mid-century, and 20 to 83 days over 95°F likely by the end of the century. As for the tail risk, there is a 1-in-20 chance of more than 15 extremely hot days over the next 5 to 25 years, increasing to 38 days by mid-century and 101 days by the century’s end. As a result, Chicago will see up to 7 additional likely deaths per 100,000 residents by late century, and a 1-in-20 chance of more than 22 additional deaths.

Even more significant is the number of Category III HHSI days this metro area will likely experience: 6 to 38 such days are likely by century-end, and the region has a 1-in- 20 chance of experiencing more than 55 days at HHSI III over this time frame—giving Chicago a higher tail risk than any other Midwest metro area we studied. These very hot and humid days are similar to what Chicago experienced during the great heat wave in 1995, which resulted in over 750 heat-related deaths over only five days.

. A Chicago resident is evacuated during a severe heat wave.

A Chicago resident is evacuated during a severe heat wave.

Likely impacts from extreme heat in the Chicago area include:

  • Rising energy costs: Chicago’s electricity demand will likely increase by 6% to as much as 17% by the end of the century. Even when combined with lower heating demand due to warmer winters, this translates into a 6% to 22% likely increase in energy costs.
  • Agricultural trade impacts: Home to the Chicago Commodity Exchange, Chicago’s economic health is tied to the health of the Illinois and Midwest agricultural economy. Illinois is likely to be the hardest-hit state in the region from crop losses from an economic standpoint, with $1.5 to $13 billion in likely losses in the state each year by end-of-century across the major commodity crops of corn, soybeans, and wheat.
  • Violent crime: The region could see a likely increase in violent crime due to hotter temperatures of up to 6% by end of century.

Des Moines

Des Moines is a smaller metro area, with a population of about 1.2 million. But what it lacks in population it makes up in being a major center of the U.S. insurance industry, located in the heart of one of the most important agricultural states in the nation. The metro area is also home to a small but vibrant manufacturing and logistics sector and is the headquarters of two Fortune 500 companies.

Des Moines – Average Summer Temperature By End Of Century. On our current emissions path, residents of Des Moines will see the average number of days over 95°F per year likely double to quadruple within the next 5 to 25 years. Among other effects, rising temperatures may affect Iowa’s robust agricultural sector, resulting in reduced crop yields. By end of century, the state could face likely declines in its signature corn crop of 17% to 77% – unless farmers employ new adaptive practices. Data Source: American Climate Prospectus.

On our current emissions path, residents of Des Moines will see the average number of days over 95°F per year likely double to quadruple within the next 5 to 25 years. Among other effects, rising temperatures may affect Iowa’s robust agricultural sector, resulting in reduced crop yields. By end of century, the state could face likely declines in its signature corn crop of 17% to 77% – unless farmers employ new adaptive practices. Data Source: American Climate Prospectus.

This city’s dependence on the insurance industry—EMSI ranked Des Moines third on its 2011 list of Nation’s Strongest Metros for Finance & Insurance Jobs26— means it has a special relationship with climate risk. The agricultural insurance industry in particular must pay close attention to increasing heat throughout the region, especially in Iowa, which we found will face the highest likely losses of any Midwest state from climate-related commodity crop yield declines. By the end of this century, absent significant adaptation by Iowa farmers, the state could face likely declines in its signature corn crop of 18% to 77%—a huge hit for a corn industry worth nearly $10 billion.27

In Des Moines, which has seen an average of about 4 days over 95°F each year for the past 30 years, our current emissions pathway will likely result in 8 to 17 such days per year on average over the next 5 to 25 years, 12 to 35 extremely hot days likely per year by mid-century, and 34 to 89 days over 95°F likely by the end of this century. There is 1-in-20 chance of more than 19 extremely hot days each year over the near term, 43 days over 95°F by mid-century, and 105 days at this temperature by century-end. At the same time—and also significant to the broader region’s agricultural producers and insurers—the area will likely see warmer winters, with the number of days below freezing dropping from an average of 143 per year over the past 30 years to likely as few as 69 days below freezing (with a tail risk of fewer than 60 days) by the end of the century.

On balance, this combination of more extremely hot days and fewer extremely cold days will tilt the Des Moines area toward higher electricity demand and energy costs and lower labor productivity, similar to other metro areas we studied. Specific economic risks include:

  • Rising energy costs: In Des Moines, if we stay on our current emissions path, electricity demand from increased air conditioning will likely rise by 6% to 16% by the end of the century. Even when combined with reductions in heating demand, this translates into a likely 8% to 29% increase in energy costs, with a 1-in-20 chance of more than a 36% increase.
  • Decreased labor productivity: Labor productivity in high-risk industries will likely drop by as much as 2.7% (with a tail risk of more than 3.5%) in this region. Our research shows that Iowa has the highest overall economic burden due to changes in labor productivity of any state in the Midwest region, possibly because of the large percent of workers in the region (nearly 40%) who work in outdoor industries like agriculture and transportation. In fact, Iowa is second only to North Dakota in the percent of all workers who are employed in the high-risk sectors most at risk for labor productivity declines as a result of climate change.

Cleveland & Toledo

As we discussed earlier, the state of Ohio is a manufacturing hub for the entire Midwest region. The city of Toledo, in particular, has a long manufacturing history, from its early days as a center for glass and window manufacturing, to its more recent incarnation as a center for solar panel manufacturing. The Solar Energy Industry Association has identified over 50 manufacturing plants in Ohio, many clustered along Lake Erie in the Cleveland/Toledo region.28

Cleveland & Toledo – Average Summer Temperature By End Of Century. On our current emissions path, residents of Cleveland and Toledo will start to see multiple days per year over 95°F, with 2 to 5 such days likely within the next 5 to 25 years. Higher temperatures will likely raise electricity demand and energy costs, decrease labor productivity, and increase violent crime over the course of the century. Data Source: American Climate Prospectus.

On our current emissions path, residents of Cleveland and Toledo will start to see multiple days per year over 95°F, with 2 to 5 such days likely within the next 5 to 25 years. Higher temperatures will likely raise electricity demand and energy costs, decrease labor productivity, and increase violent crime over the course of the century. Data Source: American Climate Prospectus.

The Cleveland/Toledo area has had, on average, fewer than one day over 95°F each year over the past 30 years. Our current emissions pathway will likely result in 2 to 5 such days each year over the next 5 to 25 years, 3 to 14 extremely hot days per year by mid-century, and 10 to 66 days over 95°F likely by the end of this century. As for the tail risks, there is a 1-in-20 chance of more than 8 days over 95°F over the near term, 24 days by mid-century, and 88 days by century-end. At the same time, the area will likely see warmer winters, with days below freezing dropping from the 30-year average of 119 per year to 44 to 75 days below freezing (with a tail risk of fewer than 28 days) likely by the end of the century.

These climate impacts will likely bring the following risks to the Cleveland/Toledo area:

  • Rising energy costs: The Cleveland area will see a likely increase of 5% to 14% in electricity demand by the end of the century. Even when combined with lower heating demand, this translates into a likely increase of 4% to 17% in energy costs.
  • Declines in labor productivity: For the Cleveland/ Toledo region, if we stay on our current emissions path, increased heat is likely to decrease labor productivity in high risk industries by up to 1.9% (with a tail risk of more than 3%) by the end of the century.
  • Violent crime: Cleveland is second only to Oakland among the nation’s largest cities for assault rates. Increased heat will likely result in as much as 5.5% more violent crime in this metro area by the end of the century.

Winter Sports Industry at Risk

There’s a reason climate change is often referred to as “global warming.” On our current emissions path, the Midwest will likely see up to a 30% drop in days below freezing by mid-century and up to 60% by late century. In some of these northern states, warmer winter temperatures may seem like a welcome treat, but as fewer and fewer days dip below freezing, the season for winter outdoor sports shrinks as well.

Winter sports are serious business in this region. The Midwest is home to almost one-fifth of the nation’s ski areas.29 Minnesota, Michigan, and Wisconsin lead other states in snowmobile registrations, with a combined total of over 732,000.30 The ski and snowmobile industries combined are worth an estimated $2.1 billion in value added to the overall region’s economy.

Snowmobiling and cross-country skiing are more vulnerable than downhill skiing to temperature changes since they rely solely on natural snowfall, rather than snowmaking equipment. On the other hand, warmer temperatures could expand the use of ski areas for outdoor activities during the spring, summer, and fall, such as mountain biking and hiking, and could present new business opportunities for these areas if owners are able to make the equipment and expertise adaptations necessary to completely alter business practices.

The hockey industry is watching these looming climate risks with concern. Fewer days below freezing could affect the region’s famous ice-based activities, including outdoor hockey and ice fishing. A 2012 study found that the length of the Canadian skating season at outdoor rinks had decreased by 20–30% over the past five decades due to changing climatic conditions, presenting a serious challenge to an industry dependent on early player training on frozen ponds, lakes, and groomed outdoor rinks.32

In 2014, the NHL voiced its concern over the impacts of climate change and water scarcity on the future of hockey in North America and detailed its actions to help slow these effects in a first-of-its-kind report.33

“The ability to skate and play hockey outdoors is a critical component of the league’s history and cul- ture. Many of the NHL’s players, both past and pres- ent, learned to skate outside on frozen lakes, ponds and backyard rinks. The game of hockey is adversely affected if this opportunity becomes unavailable to future generations.”

Warmer temperatures can also reduce the length of the ice-cover season, which is critical for ice fishing. For example, researchers at the University of Wisconsin-Madison found that the average number of days that Lakes Monona and Mendota in Madison, Wisconsin are frozen has decreased by approximately one month over the past 150 years.34

Minneapolis-St. Paul

With a population of over 5.3 million, the broader Minneapolis-St. Paul metro region—which includes suburbs crossing the border into Wisconsin—is the second largest metro area in the Midwest after Chicago. The Twin Cities boast a very diversified economy and are home to the headquarters of 17 Fortune 500 companies, with industries ranging from insurance and finance to rail and trucking services. Traditionally a hub for timber processing, the Minneapolis-St. Paul regional economy still includes agriculture and forestry, as well as food processing, financial services, and some small manufacturing.

Minneapolis-St.Paul – Average Summer Temperature By End Of Century.
On our current emissions path, residents of Minneapolis-St. Paul will see warmer winters and hotter summers, with 3 to 7 days over 95°F per year likely in the next 5 to 25 years. As a result of these seasonal changes, Minneapolis-St. Paul residents will spend less on energy to heat their homes in the winter, but more to cool them in the summer, resulting in overall energy cost increases of up to 18% likely by end of century. Data Source: American Climate Prospectus.

<br /> On our current emissions path, residents of Minneapolis-St. Paul will see warmer winters and hotter summers, with 3 to 7 days over 95°F per year likely in the next 5 to 25 years. As a result of these seasonal changes, Minneapolis-St. Paul residents will spend less on energy to heat their homes in the winter, but more to cool them in the summer, resulting in overall energy cost increases of up to 18% likely by end of century. Data Source: American Climate Prospectus.

Though this area will not see the sheer number of extremely hot days that some of the southern Midwest cities will experience as a result of climate change, Minneapolis-St. Paul will likely see a dramatic rise in days over 95°F if we stay on our current emissions path. This metro area has had, on average, 2 days per year of 95°F or higher over the past 30 years, but this number will likely rise to 3 to 7 days per year over the near term, 6 to 19 extremely hot days likely by mid-century, and 15 to 62 days over 95°F likely per year by the end of the century. There is a 1-in-20 chance that, by century’s end, this area could see as many as 85 extremely hot days per year. At the same time, Minneapolis-St. Paul is likely to experience 2 to 20 Category III days on the Humid Heat Stroke Index by the end of the century, with a 1-in-20 chance of more than 32 days, from an average of zero such days over the past 30 years.

These climate impacts will likely bring the following risks to the Minneapolis-St. Paul region:

  • Rising energy costs: Warmer temperatures will likely bring warmer winters as well: This metro area experienced an average of 154 days below 32°F on average from 1981–2010, and this number will likely decrease to 82 to 117 days below freezing (with a tail risk of fewer than 61 days) by the end of the century. As a result, Minneapolis-St. Paul residents and businesses will spend less on energy to heat their homes in the winter but more to cool them in the summer—a switch from heating fuels like natural gas to electricity. For this reason, electricity demand will likely increase throughout the century and rise up to 4% to 13% by the end of the century (with a 1-in-20 chance of a more than 18% increase.) Even when combined with changes in heating demand, this translates into a likely increase of 4% to 18% in energy costs.
  • Increase in violent crime: Even though temperatures in this region will not shoot up as much as in the more southern Midwest states, the dramatic increase in hot days will likely translate into increases in violent crime in this metro region of up to 6.4%—the largest increase in crime of any metro area we studied. There is a 1-in-20 chance that violent crime could increase by more than 8.1% in this time period, if we stay on our current emissions path.

Madison & Milwaukee

Located in America’s Dairyland, the Madison/Milwaukee metro area economy is driven in part by the state’s strong focus on agriculture and food processing. Wisconsin produces about a quarter of America’s cheese, leading the nation in cheese production; the state is also second in milk and butter production. Madison and Milwaukee are Wisconsin’s major urban areas, and while both are home to core food processing companies, they also have diversified into healthcare, biotech, and government services. Milwaukee is also home to the international headquarters of six Fortune 500 companies and was recently selected to join the Global Cities Initiative as a result of its commitment to promote global trade and economic competitiveness.

Madison & Milwaukee – Average Summer Temperature By End Of Century. On our current emissions path, residents of Madison and Milwaukee will see the average number of days over 95°F per year likely increase from just 1 over the past 30 years to 2 to 7 likely within the next 5 to 25 years. As a result of these seasonal changes, Madison and Milwaukee residents will spend less on energy to heat their homes in the winter, but more to cool them in the summer, resulting in overall energy cost increases of up to 15% likely by end of century. Data Source: American Climate Prospectus.

On our current emissions path, residents of Madison and Milwaukee will see the average number of days over 95°F per year likely increase from just 1 over the past 30 years to 2 to 7 likely within the next 5 to 25 years. As a result of these seasonal changes, Madison and Milwaukee residents will spend less on energy to heat their homes in the winter, but more to cool them in the summer, resulting in overall energy cost increases of up to 15% likely by end of century. Data Source: American Climate Prospectus.

The Madison/Milwaukee region is not known for its extremely warm weather, boasting only 1.2 days per year over 95°F on average during the past 30 years. If we stay on our current emission pathway, this will change: The metro region will likely see 2 to 7 extremely hot days on average over the next 5 to 25 years, 4 to 17 such days likely by mid-century, and 11 to 59 days— nearly two months—over 95°F likely by the end of the century. The tail risk is more sobering: There is a 1-in-20 chance this metro region will experience more than 83 extremely hot days by century-end. To put this in context, in the period from 2040–2059, this area will likely experience average summer temperatures that feel like average summers in St. Louis today.

Warmer weather means warmer winters, and this region, which experienced 137 days per year below freezing for 1981–2010, will likely see this number shrink to as few as 116 to 129 such days per year on average over the next 5 to 25 years (with a tail risk of fewer than 96 days), 97 to 119 days per year below freezing by mid-century (tail risk of less than 78 days), and 57 to 96 days per year below freezing likely by century’s end (tail risk of fewer than 38 days). This drop from more than three months of below-freezing days to fewer than two months of such days is one of the more dramatic likely temperature changes we found in this region. While the news of warmer winters may cheer cold Madison and Milwaukee residents, it could have significant impacts on the region’s winter tourism and its all-important pond and lake hockey traditions.

. Residents of Madison, Wisconsin, play ice hockey on the frozen Lake Monona.

Residents of Madison, Wisconsin, play ice hockey on the frozen Lake Monona.

Warm temperatures in this area will likely lead to the following economic impacts:

  • Rising energy costs: Wisconsin’s core industries of agriculture and food processing are energy-intensive. Electricity is used throughout the dairy processing industry to drive process motors, fans, pumps, and compressed air systems, as well as building lighting and HVAC systems. In the dairy industry, electricity powers farm machinery such as milking machines, but also provides cooling, freezing, and cold storage.35 Our research found that, if we stay on our current path, the Madison/Milwaukee region will see likely electricity demand increases of 1% to 4% by mid-century and 4% to 13% by the end of the century. Even when combined with reductions in heating demand, this translates into a likely increase of 2% to 15% in energy costs.
  • Increase in violent crime: Warmer temperatures in the summer will lead to likely increases in violent crime in this metro area of as much as 6.2% by the end of the century, with a 1-in-20 chance of increases more than 7.7%.

Detroit

The Detroit metro area, home to over 6.8 million, is a major manufacturing, financial, and transportation center. In particular, Detroit serves as a major port on the Detroit River, connecting the Great Lakes system to the St. Lawrence seaway. Detroit is best known for auto manufacturing, which still plays a major role in the metro area’s economy. Recently the area has moved into more advanced manufacturing activities and their associated industries, like nanotechnology, computer systems, and electric and hydrogen drive train innovation. Even with these advances, however, Detroit faces major manufacturing competition from other regions and countries, and has lost more than half its population in the past fifty years.

Detroit – Average Summer Temperature By End Of Century. On our current emissions path, residents of Detroit will likely see the average number of days over 95°F per year increase from 1 over the past 30 years to 3 to 7 within the next 5 to 25 years. Higher temperatures will likely raise electricity demand and energy costs and increase violent crime over the course of the century. Data Source: American Climate Prospectus.

On our current emissions path, residents of Detroit will likely see the average number of days over 95°F per year increase from 1 over the past 30 years to 3 to 7 within the next 5 to 25 years. Higher temperatures will likely raise electricity demand and energy costs and increase violent crime over the course of the century. Data Source: American Climate Prospectus.

In our analysis, Detroit’s climate risks are primarily heat-related: The metro region, which saw only 1.3 days on average over 95°F over the past 30 years, will see a likely increase in these days of 3 to 7 over the next 5 to 25 years, 5 to 16 likely by mid-century, and 15 to 67 extremely hot days per year likely by end of century. Looking at the tail risks, there is a 1-in-20 chance the Detroit area will experience more than 87 extremely hot days each year by the century’s end. That is a huge increase in a city accustomed to cooler weather, and it will have significant impacts, particularly in the following areas:

  • Increase in energy costs: The Detroit metro area, famously dependent on energy-intensive manufacturing, will likely see an increase of 4% to 13% in electricity demand by the end of the century if we stay on our current path. When combined with lower heating demand, this corresponds to a 3% to 15% likely increase in energy costs.
  • Increase in violent crime: Detroit claimed the highest overall crime36 among cities with 250,000 or more residents in 2011; and with 342 murders in 2011, Detroit trailed only New Orleans in its homicide rate. If we stay on our current emissions path, these numbers will only increase: Our research shows a likely increase in violent crimes of as much as 5.9% by the end of the century, with a 1-in-20 chance of an increase more than 7%.

As a lifelong Midwesterner, I’m gravely concerned that our “business as usual” path is dangerous, unsustainable and threatens our way of life. Our business leaders, our cities, and our investment community need to focus on these risks and act now before it’s too late.

Henry M. Paulson — Risky Business Co-Chair, Former U.S. Secretary of the Treasury, and Chairman of The Paulson Institute

Additional Midwest Climate Risks

For scientists studying climate change, the connections between increased greenhouse gas emissions and increased heat are very clear. For this reason, the Risky Business Project analysis has focused primarily on these connections and the corresponding economic impact of increased heat on commodity agriculture, energy demand, labor productivity, crime, and heat-related mortality.

But these are not the only potential, or even likely, climate risks facing this region. Scientists have high confidence that climate change will also affect precipitation, for instance, which could lead to inland flooding and/or drought. The Great Lakes, which define the Midwest region, are potentially subject to extreme variability in lake levels, which could seriously affect trade, transportation, and recreational activities in the region. And of course the Midwest is not a self-contained region: Climate risks here may have ripple effects across the nation and the globe.

In this section, we examine some of the less clear, but no less severe, potential climate risks facing the Midwest. Our research here is qualitative rather than quantitative but is based on a review of some of the best climate science available.

Precipitation

We know that climate change leads to increased heat, which will affect different regions to varying degrees. It will also alter precipitation patterns, although the extent of change—whether in the form of flooding or drought— is more difficult to predict.

As temperatures rise, the atmosphere may hold more water vapor, increasing the level of precipitation—falling as rain or snow—in the Midwest region. On the other hand, higher temperatures can also increase evaporation from lakes, soils, or reservoirs, which can lead to drought. In either case, the Midwest is at risk: Precipitation is the region’s primary source of freshwater through runoff into rivers, lakes, and other surface water bodies, and also through recharge of groundwater. As a result, drought can be catastrophic to industries and communities. The Midwest recently experienced the economic impacts of a drought season on Mississippi River freight traffic.

Flooding, too, carries risks, as floods may drown crops and put infrastructure at risk. For example, in 2008, record rainfall led to region-wide floods, causing 24 deaths and $11 billion in losses from damaged property, reduced agricultural yields, and closure of critical transportation routes.37

Our research shows that if we stay on our current emissions path, average annual precipitation levels across the Midwest will likely increase by mid-century and late century compared to the average levels experienced over the past three decades. However, these annual regional averages can mask differences in seasonal or local precipitation patterns, which are critical for rain- or snow-dependent industries such as agriculture and tourism. For example, the Midwest has a higher likelihood of increased precipitation in the spring than does the U.S. as a whole, with most Midwestern states “very likely” to see increased precipitation in the spring months by late century.38 In winter and fall, precipitation levels in most Midwest states will likely increase though this will vary across the region. Summertime precipitation for the region is more likely than not to decrease, particularly in Iowa and Wisconsin, but to a lesser extent in Illinois, Michigan, Minnesota, and Missouri. Indiana and Ohio, on the other hand, will more likely than not experience an increase in summertime precipitation levels by late century.

According to the most recent National Climate Assessment, the region will also see a higher average number of days without rainfall or snow, which could lead to agricultural droughts, reduced yields, and other economic impacts on key sectors in the future.39 These longer dry spells reflect precipitation falling in more intense storms.

It is not just the total amount of precipitation that will change, but also the intensity and frequency of heavy precipitation events in the region. The overall Midwest region should expect to see increases in heavy storms and longer periods between these events. This combination of heavy precipitation and longer periods between storms has historically led to flooding. While it is difficult to estimate future flood risk due to the myriad factors on which it depends (e.g. topography, soil levels, and land use decisions), studies have found that flood risk severity and frequency in the region may well increase if we stay on our current emissions pathway.

Water Quality

Climate-related impacts throughout the Midwest region, including changing air and water temperatures, precipitation intensity, and periodic drought, can have serious effects on water quality. For example, as air and water temperatures rise, thermal stratification—the creation of distinct layers of water in lakes and reservoirs based on differing temperatures—can increase. As a result, nutrients and pollutants stored in the bottom sediments of these bodies of water can be released. More intense precipitation can also affect water quality by increasing the levels of nutrients, sediments, and contaminants in lakes, reservoirs, and other water bodies, especially when combined with increased wildfire activity due to climate change. It can also lead to health problems if flooding overwhelms sewer systems, which is a serious concern given that many cities in the Midwest have combined storm and sewage drainage systems that were not designed to handle these extreme precipitation events. A recent study found that, if we continue on our current emissions path, increased intense storm events will increase sewer overflows into Lake Michigan by up to 120% by late century.40

Great Lakes Impact

The Great Lakes, which hold the largest supply of fresh water in the world, are one of the defining features of the Midwest. The Great Lakes may experience a wide range of impacts from a changing climate, including warmer water temperatures, loss of ice cover, and more variable lake levels. This is expected to affect the region’s fisheries, wetland, coastlines, and lake ecosystems: For instance, warmer water temperatures could alter habitat for cold-water fish species such as brook trout and walleye, decreasing the extent of their habitat and limiting attraction for visiting cold-water fishermen. Lake-dependent economic activities, such as shipping, recreation, and tourism, may also be affected by variable lake levels and ice formation.

Dwindling ice cover on the lakes will have mixed effects on trade, coastal property, and lake species. It is possible that less ice cover could actually benefit waterborne commerce by lengthening the shipping season on the lakes. At the same time, shores may become more vulnerable to erosion and flooding from intense storms without the ice’s protection, putting coastal property and fish habitat at risk. And despite a long-term trend of decreasing ice cover over the past 40 years, increased variability in the amount of ice could present challenges for the shipping industry.41 For example, in November 2014, parts of the Great Lakes and upper Mississippi River saw ice earlier than expected based on previous records, effectively ending waterborne commerce for the season on the upper Mississippi.

There is considerable uncertainty in how climate change, particularly changes in precipitation and evaporation, will affect water supplies within the Great Lakes Basin. There is also uncertainty about whether these changes will be uniform across all lakes.42 Moreover, seasonal and annual variability of lake levels will be affected by a whole host of other climate change impacts, including increased air temperatures, changes in winter and spring storm intensity and frequency, loss of ice cover on the lakes and connecting channels, and drier conditions in the summer.43

Risks to Critical Infrastructure

Climate change will also place additional strain on the Midwest’s aging transportation, water, and energy infrastructure.

We discussed potential impacts on one of the region’s most important transportation systems, the Mississippi River. Surface transportation is just as vulnerable to changing precipitation patterns and warmer temperatures. For example, extreme temperatures could cause rail lines, which are designed to withstand 90–110°F depending on location, to buckle. High temperatures can also compromise pavement integrity (eg. softening asphalt and increasing rutting from traffic).44 45 Low-lying roads, rails, and transit systems are also vulnerable to flooding in times of increased precipitation.

The region’s energy and water infrastructure is also at risk. Increased heat will place additional stress on the region’s energy systems, simultaneously decreasing system efficiency and performance as system operators struggle to cool down facilities at the same time that peak electricity consumption goes up. Warmer water temperatures can also lead to reductions in power plants’ operating capacities. For example, in summer 2006, a unit at the D.C. Cook Nuclear Power Plant was turned off for multiple days because air temperatures in the containment building rose above 120°F, and the water in Lake Michigan had become too warm to use in cooling the reactors.46 Two months later, Exelon’s Quad Cities Generating Station in Illinois reduced its energy production by almost half due to high water temperatures of the Mississippi River, which prevented plant operators from discharging the water used to cool the reactors.47

Finally, changes in the timing and amount of precipitation will affect the availability of hydropower in the region, which provided 5,737,000 MWh in 2012.48

Risks to National and Global Supply Chains

The Midwest region of the U.S. does not exist in a vacuum. This region is a major exporter of agricultural and manufacturing products to the entire globe, meaning that climate risks that affect industries in this region can have ripple effects far beyond the borders of these eight states. Moreover, climate risks to the supply chains of the agricultural and manufacturing industries based in the Midwest can have a profound effect on the economy of this region.

The Risky Business Project’s quantitative research stops at the U.S. borders, and this report focuses specifically on the Midwest. However, we know from research done outside the U.S. that the climate risks we analyzed, especially those related to extreme heat, exist to a far greater degree in other U.S. regions and other countries—some of which are critical pieces of supply chains that depend on, or are critical to, the Midwest. For example, Ford Motor Company is a signature business in Detroit, Michigan. Climate impacts in Detroit itself are relatively mild; however, Ford has a supply chain that includes assembly facilities in the more severely affected U.S. areas of Kansas City and Kentucky (part of the hard-hit Southeast region, as we discussed in detail in the original Risky Business report49). Ford also relies on manufacturing in far warmer and potentially riskier locations in Mexico, Venezuela, Thailand, and South Africa.50 In the agricultural sector, Minnesota-based Cargill, Inc. relies on producers across the world, including substantial operations to the south in Latin America.51

While global companies like Ford and Cargill can adapt to changing climate conditions in the short term by shifting supply chains, in the long term these kinds of companies will need to take a hard look at their climate risk across all their operations to determine what level of risk they are actually willing to take on. Ultimately, multinational companies—and their investors, insurers, and shareholders—may be in the best position to demand a truly global solution to climate change, to bring down long-term risks and create some certainty and stability for their operations into the future.

Conclusion: Mitigating Risks

Taking a classic risk assessment approach to climate change in the Midwest leads to the inescapable conclusion that if we continue on our current climate path, this region faces multiple risks across every state and metro area.


But risk assessment is not just about identifying risks and leaving it at that. Our research also shows that if we act today to move onto a different path, we can still avoid many of the worst impacts of climate change, particularly those related to extreme heat. We are fully capable of managing climate risk, just as we manage risk in many other areas of our economy and national security—but only if we start to change our business and public policy decisions today.

The Risky Business Project was not designed to dictate a single response to climate risk. We know that there will be a diversity of responses to our analysis depending on the particular risk tolerance of individual business and policy actors, as well as their particular region or sector of the economy. But the Risk Committee does believe, based on this project’s independent research and the significance of the climate risks it demonstrates, that it is time for all Midwest business leaders and investors to get in the game and rise to the challenge of addressing climate change. The fact is that, just as the investments and economic choices we made over the past several decades have increased our current vulnerability to climate change, so will the choices we make today determine what our nation looks like over the next 25 years, at mid-century, and by 2100.

In short, we have a choice whether we accept the climate risks laid out above or whether we get on another path. This is not a problem for another day. The investments we make today—this week, this month, this year—will determine our economic future.

There are three general areas of action that can help to minimize the risks Midwest businesses currently face from climate change:

Changing everyday business practices to become more resilient.

Some of the climate impacts we analyzed are already being felt across the nation; indeed, some are already an unalterable part of our economic future. Rational business actors must adapt. In the Midwest, the agricultural sector is on the front lines of climate adaptation. As Risk Committee member Greg Page has noted,

“Farmers are innovators and consummate optimizers…. They persistently demonstrate the ability to adapt to changes in the environment and successfully adopt new technologies.”52

But this adaptation may come at a price: Some farmers in the most-affected southern Midwest counties, for instance, may suffer economic losses shifting to new crops (with required new equipment and expertise), if they can afford to shift at all. Meanwhile, cities across the region are being forced to adapt to climate realities, such as rising energy costs and mortality rates, without adequate financial support from the federal government.

Incorporating risk assessment into capital expenditures and balance sheets.

Another area where today’s business investments have a direct relationship to tomorrow’s climate impacts is in long-term capital expenditures, which will live well into the middle of the century and beyond. Today, ratings agencies are evaluating infrastructure projects with a multi-decade lifespan. Utilities are making investments in new power plants and pipelines, and signing long- term power purchase agreements that rely on those investments. And real estate investors are making multiple bets on residential and commercial properties.

These investments must be evaluated in terms of the actual climate risk specific regions face as we approach the middle of this century. In 2010, recognizing this reality, the Securities and Exchange Commission (SEC) issued Interpretive Guidance on climate disclosure, giving companies some idea of how to consider their “material” risks from climate change; unfortunately, as of 2013, over 40% of companies listed on the Standard & Poor’s 500 Index were still not voluntarily disclosing climate risks.53

Figure 10. Our research examines the risks of the U.S. continuing on its current path, or “business as usual.” Alternate pathways that include investments in policy and other efforts to mitigate climate change through lowering carbon emissions could significantly reduce these risks. Original data source, adapted: Meinshausen, M., Smith, S. J., Calvin, K., Daniel, J. S., Kainuma, M. L. T., Lamarque, J.-F., … Vuuren, D. P. P. van, “The RCP greenhouse gas concentrations and their extensions from 1765 to 2300,” Climatic Change 109(1-2) (2011): 213–241.

Our research examines the risks of the U.S. continuing on its current path, or “business as usual.” Alternate pathways that include investments in policy and other efforts to mitigate climate change through lowering carbon emissions could significantly reduce these risks. Original data source, adapted: Meinshausen, M., Smith, S. J., Calvin, K., Daniel, J. S., Kainuma, M. L. T., Lamarque, J.-F., … Vuuren, D. P. P. van, “The RCP greenhouse gas concentrations and their extensions from 1765 to 2300,” Climatic Change 109(1-2) (2011): 213–241.

Global Emissions Scenarios

Instituting policies to mitigate and adapt to climate change.

Ultimately, climate change is not just an issue for specific sectors and regions: It is a global issue that demands an effective policy response from the U.S. According to the latest Intergovernmental Panel on Climate Change report, the world may have as little as 15 years to “keep planetary warming to a tolerable level,” through an aggressive push to bring down carbon emissions.54

In the Risky Business Project, we focused primarily on modeling our current economic path and the attendant climate risks. Because this is the path we’re now following as a nation, we need to better understand the potential risks it poses and decide how to respond to those risks—especially those that are already embedded in our economy because of decisions we made decades ago.

But the path we’re on today does not have to be the path we choose to follow tomorrow. Our analysis also looks at alternate pathways that include investments in policy and other efforts to mitigate climate change through lowering greenhouse gas emissions. These alternate pathways could significantly change the climate impacts we discuss above. For example, modest global emission reductions can avoid up to 80% of projected economic costs resulting from increased heat-related mortality and energy demand.

Our goal in this report is not to dictate those policy pathways. However, we do strongly urge the Midwest business community to play an active role in supporting this region’s policymakers and elected officials as they take steps toward climate mitigation and preparedness, so that this region can model the kind of behavior we need to see nationally on these issues. The Midwest is already taking steps in this direction, with states across the region investing in renewable energy, industrial efficiency, and alternative vehicles and fuels.55 These activities are critical in showing regional public and private sector leadership in addressing short-term climate actions and long-term climate risk. Ultimately, the single most effective way for businesses to decrease the risks we have identified in this project is for business leaders to push for strong and consistent public sector action to address those risks.

With this project, we have attempted to provide a common language for how to think about climate risk—built upon a common language of risk that is already part of every serious business and investment decision we make today. If we have a common, serious, non-partisan language describing the risks our nation may face from climate change, we can use it as the springboard for a serious, non-partisan discussion of the potential actions we can take to reduce our regional, national, and ultimately global climate risks.

View footnotes

  1. Risky Business follows the National Climate Assessment definition of the Midwest region to include the following states: Illinois, Indiana, Iowa, Michigan, Minnesota, Missouri, Ohio, and Wisconsin.
  2. Kate Gordon, “Risky Business: The Economic Risks of Climate Change in the United States” (The Risky Business Project, 2014), available at http://riskybusiness.habitatseven.work.
  3. The “current greenhouse gas emissions pathway” we use throughout the report refers to RCP 8.5, one of the four “Representative Concentration Pathways” developed by the Integrated Assessment Modeling Consortium. It represents a continuation of recent global emissions growth rates, with atmospheric concentrations of CO2 reaching 940 ppm by 2100.
  4. USDA, “2007 Census of Agriculture: Farm and Ranch Irrigation Survey (Vol.3)” (2010), available at http://www.agcensus.usda.gov/Publications/2007/Online_Highlights/Farm_and_Ranch_Irrigation_Survey/fris08.pdf
  5. Midwestern Governors Association, “The Midwestern economy is strongly rooted in manufacturing,” available at http://www.midwesterngovernors.org/Publications/Manufacturing.pdf
  6. The Risky Business Project describes the combined levels of high heat and humidity using what the ACP calls the “Humid Heat Stroke Index (HHSI),” which is derived from a scientific measure known as “wet bulb” temperature. Under high Humid Heat Stroke Index conditions, core body temperature may rise to the point of heat stroke or death. The ACP classifies HHSI into four different categories of severity–I: “Uncomfortable”; II: “Dangerous”; III: “Extremely dangerous”; IV: “Extraordinarily dangerous.”
  7. Elizabeth Burakowski and Matthew Magnusson, “Climate Impacts on the Winter Tourism Economy in the United States” (National Resources Defense Council & Protect Our Winters, 2012), available at http://www.nrdc.org/globalwarming/files/climate-impacts-winter-tourism-report.pdf
  8. Brian Bienkowski, “‘Explosion’ of gill lice besets Wisconsin’s beloved fish,” The Daily Climate, November 14, 2014, available at http://www.dailyclimate.org/tdc-newsroom/2014/11/gill-lice
  9. S.C. Pryor, D. Scavia, C. Downer, M. Gaden, L. Iverson, R. Nordstrom, J. Patz, and G. P. Robertson, “Ch. 18: Midwest.” in J. M. Melillo, T.C. Richmond, and G. W. Yohe, “Climate Change Impacts in the United States: The Third National Climate Assessment” (U.S. Global Change Research Program: 2014), pp. 418-440, available at http://www.globalchange.gov/ncadac
  10. U.S. Bureau of Labor Statistics,“The Recession of 2007- 2009” (February 2012), available at http://www.bls.gov/spotlight/2012/recession/pdf/recession_bls_spotlight.pdf
  11. Rhodium Group estimate based on U.S. Census and Department of Commerce data. Population: County Population by Sex and 5-year Age Cohort, from 2010- 2012 US Census Bureau estimates based on 2010 Census, available at http://www.census.gov/popest/data/counties/asrh/2012/PEPAGESEX.html. Downloaded 16 September, 2014. GDP by state: Bureau of Economic Analysis, from State GDP for all industries and regions, 2008-2013, available at http://www.bea.gov/iTable/iTable.cfm?reqid=70&step=1&isuri=1&acrdn=1. Accessed 08/07/2014. GDP by urban area is equal to BEA state GDP distributed by county using IMPLAN county-level value added (IMPLAN Group: 2012 Implan National Data Package)
  12. USDA,“2007 Census of Agriculture:Farm and Ranch Irrigation Survey (Vol.3)” (2010), available at http://www.agcensus.usda.gov/Publications/2007/Online_Highlights/Farm_and_Ranch_Irrigation_Survey/fris08.pdf
  13. Gary Brester,“Wheat,”AgriculturalMarketingResource Center, April 2012, available at http://www.agmrc.org/commodities__products/grains__oilseeds/wheat/; Winter wheat production from USDA National Agricultural Statistics Service; map of winter wheat production available at http://www.usda.gov/oce/weather/pubs/Other/MWCACP/Graphs/USA/US_WheatWinter.pdf
  14. L.H. Ziska, J.R. Teasdale,& J.A. Bunce,“Future atmospheric carbon dioxide may increase tolerance to glyphosate,” Weed Science, 47: 608-615, available at http://www.jstor.org/discover/10.2307/4046118?uid=2&uid=4&sid=21105420758433
  15. L.H. Ziska, “Global Climate Change and Carbon Dioxide: Assessing Weed Biology and Management,” in C. and D. Rosenzweig & Hillel (Eds.), Handbook of climate change and agroecosystems: Impacts, adaptation and mitigation, pp. 191–208 (Hackensack, NJ: World Scientific Publishing, 2010)
  16. U.S. Bureau of Labor Statistics, “The Recession of 2007- 2009” (February 2012), available at http://www.bls.gov/spotlight/2012/recession/pdf/recession_bls_spotlight.pdf
  17. U.S.ClusterMappingProject,“Cluster:A Regional Concentration of Related Industries,” available at http://clustermapping.us/cluster
  18. This population estimate (2012) includes residents in all counties within the broader St. Louis metro areas and is therefore higher than population of St. Louis proper. This is the case for the populations of all metro areas presented in this report. The counties included in each metro area are shown in the graphics. Data source: US Census, available at http://www.census.gov/popest/data/counties/asrh/2012/PEPAGESEX.html
  19. Missouri Department of Health & Senior Services,“2010 Vital Statistics (Provisional),” available at http://health.mo.gov/data/focus/pdf/FOCUS_Oct11.pdf
  20. For more information, see American Climate Prospectus
  21. Adam Allington, “Water Fight: Drought, Farming, Fracking and the Midwest’s Tense Shipping Situation,” St. Louis Public Radio, December 4, 2012, available at http://news.stlpublicradio.org/post/water-fight-drought-farming-fracking-and-midwests-tense-shipping-situation
  22. Island Press, “Climate Change in the Midwest: A Synthesis Report for the National Climate Assessment,” (2014) available at http://islandpress-org.orientedhosting.com/dms/ip/free-chapter-pdfs/NCA-Midwest-FINAL/NCAMidwestFINAL.pdf
  23. Christine Hauser,“Flooding Takes Economic Toll, and It’s Barely Done,” The New York Times, May 17, 2011, available at http://www.nytimes.com/2011/05/18/us/18river.html?_r=0
  24. U.S.Department of Energy,“U.S.EnergySector Vulnerabilities to Climate Change,” July 2013, available at http://energy.gov/sites/prod/files/2013/07/f2/20130710-Energy-Sector-Vulnerabilities-Report.pdf
  25. Johanna Rizzo,“How Drought on the Mississippi River Impacts You,” National Geographic, January 31, 2013, available at http://news.nationalgeographic.com/news/2012/12/121207-nation-mississippi-river-drought-environment-economy/
  26. JoshuaWright,“The Nation’s Strongest Metros for Finance & Insurance Jobs,” EMSI, December 5th, 2011, available at http://www.economicmodeling.com/2011/12/05/the-nations-strongest-metros-for-finance-insurance-jobs/
  27. USDA,“2013 State Agricultural Overview: Iowa,”available at http://www.nass.usda.gov/Quick_Stats/Ag_Overview/stateOverview.php?state=IOWA
  28. Solar Energy Industries Association, “Ohio Solar,”available at http://www.seia.org/state-solar-policy/ohio
  29. Sarah Nicholls,“Outdoor Recreation and Tourism,” (Great Lakes Integrated Sciences and Assessments (GLISA) Center, 2012), U.S. National Climate Assessment Midwest Technical Input Report, available at http://glisa.umich.edu/media/files/NCA/MTIT_RecTourism.pdf
  30. Elizabeth Burakowski and Matthew Magnusson, “Climate Impacts on the Winter Tourism Economy in the United States,” (2012) available at http://www.nrdc.org/global-warming/files/climate-impacts-winter-tourism-report.pdf
  31. Elizabeth Burakowski and Matthew Magnusson, “Climate Impacts on the Winter Tourism Economy in the United States,” (2012) available at http://www.nrdc.org/global-warming/files/climate-impacts-winter-tourism-report.pdf
  32. Mike Richter,“Afterword: Mike Richter,”available at http://www.nhl.com/green/report/#commissionerLetter-Continued (last accessed December 2014)
  33. “2014 NHL Sustainability Report,” available at http://www.nhl.com/green/report/ (last accessed December 2014)
  34. Wisconsin Educational Communications Board, “Climate Wisconsin: Stories from a State of Change,” (2014) available at http://climatewisconsin.org/story/ice-cover (last accessed December 2014)
  35. Lawrence Berkeley National Lab,“Energy Efficiency Improvements and Cost Saving Opportunities for the Dairy Processing Industry,” October 2011, available at http://www.energystar.gov/ia/business/industry/downloads/Dairy_Guide_Final.pdf
  36. Les Christie,“Most Dangerous U.S. Cities,”CNN, January 23, 2013, available at http://money.cnn.com/gallery/real_estate/2013/01/23/dangerous-cities/index.html
  37. NOAA National Climatic Data Center,“Billion-Dollar US Weather/Climate Disasters 1980-2013,” (2013), available at http://www.ncdc.noaa.gov/billions
  38. The use of the term “very likely”refers to a 90% probability, while “more likely than not” describes a probability of more than 50%.
  39. Pryor, Scavia and others,“Chapter 18: Midwest”.
  40. J.A. Patz, S.J. Vavrus, C.K. Uejio, and S.L. McLellan, “Climate Change and Waterborne Disease Risk in the Great Lakes Region of the U.S.,” American Journal of Preventive Medicine 35 (5) (2008): 451-458.
  41. X. Bai & J. Wang, “Atmospheric teleconnection patterns associated with severe and mild ice cover on the Great Lakes,” Water Quality Research Journal of Canada 47 (2012): 421-435.
  42. S.D. Mackey, J. Andresen, J. Hatfield, and D. Bidwell, “Great Lakes Nearshore and Coastal Systems,” (2012), in U.S. National Climate Assessment Midwest Technical Input Report, available at http://glisa.umich.edu/media/files/NCA/MTIT_Coastal.pdf
  43. Michael Hirtzer,“Ice to close upper Mississippi from November 20, earliest on record” November 19, 2014, available at http://www.reuters.com/article/2014/11/20/us-mississippi-river-minnesota-idUSKCN0J400320141120
  44. U.S. Department of Energy, Volpe National Transportation Systems Center, “Track Buckling Research,” available at http://www.volpe.dot.gov/infrastructure-systems-engineering/structures-and-dynamics/track-buckling-research
  45. National Research Council of the National Academies, “Potential Impacts of Climate Change on U.S. Transportation,” (2008), available at http://onlinepubs.trb.org/onlinepubs/sr/sr290.pdf
  46. U.S. Department of Energy,“U.S. Energy Sector Vulnerabilities to Climate Change,” July 2013, available at http://energy.gov/sites/prod/files/2013/07/f2/20130710-Energy-Sector-Vulnerabilities-Report.pdf
  47. United States Nuclear Regulatory Commission, “Power Reactor Status Report for August 2, 2006,” available at http://www.nrc.gov/reading-rm/doc-collections/event-status/reactor-status/2006/20060802ps.html
  48. National Hydropower Association, “Midwestern U.S. Hydro Generation Profile, 2012,” available at http://www.hydro.org/why-hydro/available/hydro-in-the-states/midwest/
  49. Kate Gordon, “Risky Business”.
  50. Ford Motor Company, “Global Links,”available at http://corporate.ford.com/our-company/operations-worldwide/global-operations-list
  51. Cargill, “Farmer Services,”available at http://www.cargill.com/products/farmer/
  52. Kate Gordon, “Risky Business”
  53. Barry B. Burr, “Ceres: SEC needs to better enforce climate change disclosure requirements,” Pensions and Investments, February 7, 2014, available at http://www.pionline.com/article/20140207/ONLINE/140209893/ceres-sec-needs-to-better-enforce-climate-change-disclosure-requirements
  54. Justin Gillis, “Climate Efforts Falling Short, U.N. Panel Says,” The New York Times, April 13, 2014, available at http://www.nytimes.com/2014/04/14/science/earth/un-climate-panel-warns-speedier-action-is-needed-to-avert-disaster.html?_r=0
  55. The Energy Foundation, “The Midwest: A Leader in Clean Energy” (2012), available at http://www.ef.org/wp-content/uploads/2013/11/2012_EF_Annual_Report.pdf

Share this post

Stay informed

Your email address will never be given to third parties. All of our emails contain an “unsubscribe” link.

Close

Connect with us

Media inquiries General inquiries