California Report

From Boom to Bust? Climate Risk in the Golden State

This report identifies the economic risks posed by a changing climate in the state of California. The report explains that California is likely to face economic challenges due to increasing temperatures and sea level rise exacerbated by climate change. The report includes analysis of the risks faced by different regions of the state.

Explore by region

Executive Summary

California is the most populous state in the United States and the world’s eighth—soon to be seventh— largest economy. It’s also a microcosm of the nation’s diverse economy and geography. With a wealth of natural resources, California leads the U.S. in agriculture, manufacturing, and tourism and is a major international exporter. From high-tech to Hollywood, California is a hub of innovation that supports cutting edge industries and leading multinational companies. For decades, the state has led the way on new economic growth models, new technologies, and creative solutions to policy challenges.

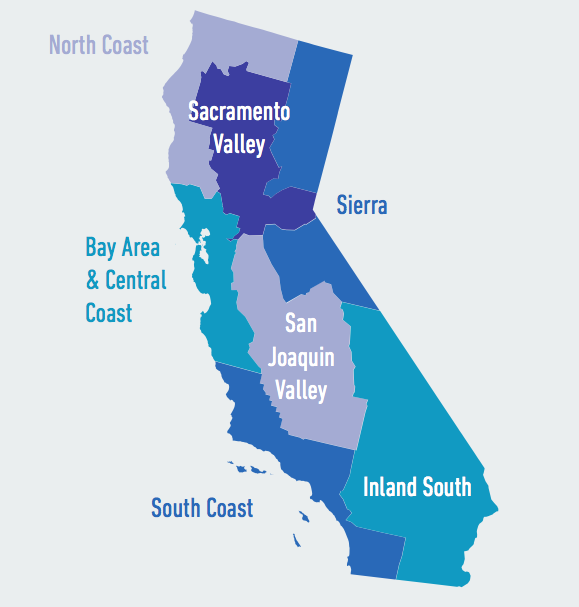
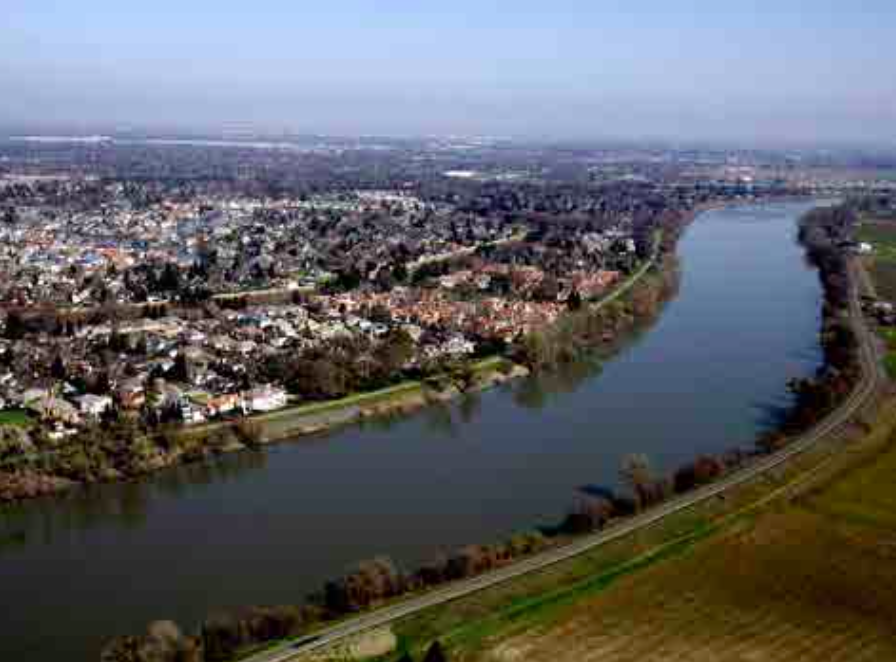
Today, California faces a new set of challenges and opportunities in the form of climate change. The state’s vast and varied topography—from the Redwood Coast to the fertile Central Valley, and from the Mojave Desert to the Sierra Nevadas—provides a glimpse into the significant and varied risks the state faces if we stay on our current climate course.

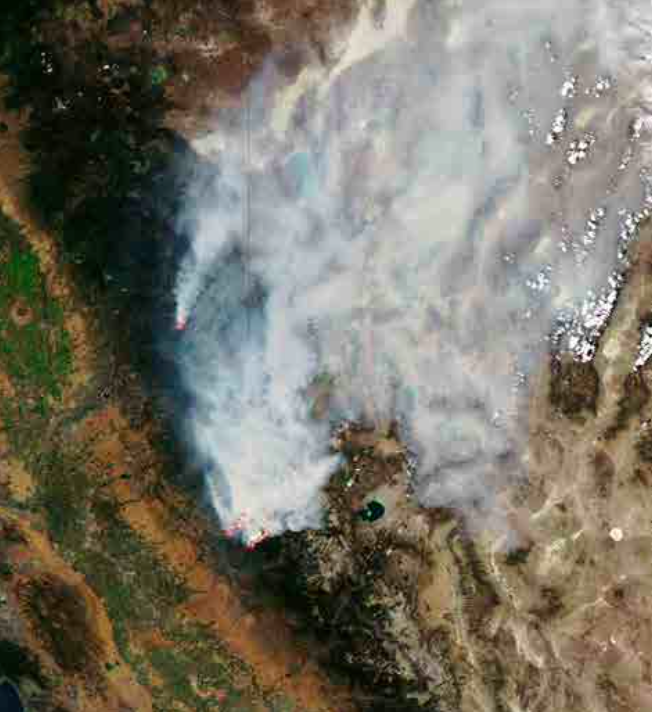
Along the coast, rising sea-levels will likely put billions of dollars of property and infrastructure at risk. Further inland, increasingly warm and dry conditions threaten the productivity of one of the richest agricultural regions in the world. Eastern California, a haven for natural recreation and tourism, will be permanently marked by warming temperatures and shifting precipitation patterns. And across the state, extreme heat will fuel large and costly wildfires, endanger water resources, drive up energy costs, exacerbate air pollution, and threaten human health.

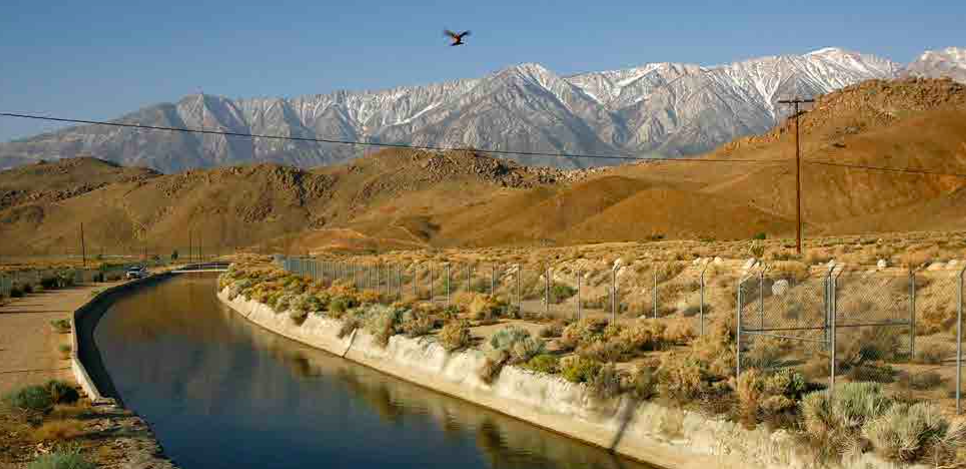
LA Aqueduct. The Los Angeles Aqueduct, Lone Pine, California

The Los Angeles Aqueduct, Lone Pine, California

The mission of the Risky Business Project is to quantify the economic risks to the United States from unmitigated climate change. Our inaugural report, Risky Business: The Economic Risks of Climate Change in the United States, highlighted these risks across every region of the country, with a focus on three sectors: agriculture, energy demand, and coastal infrastructure. We also looked at overarching issues such as changes in labor productivity and heat-related mortality.

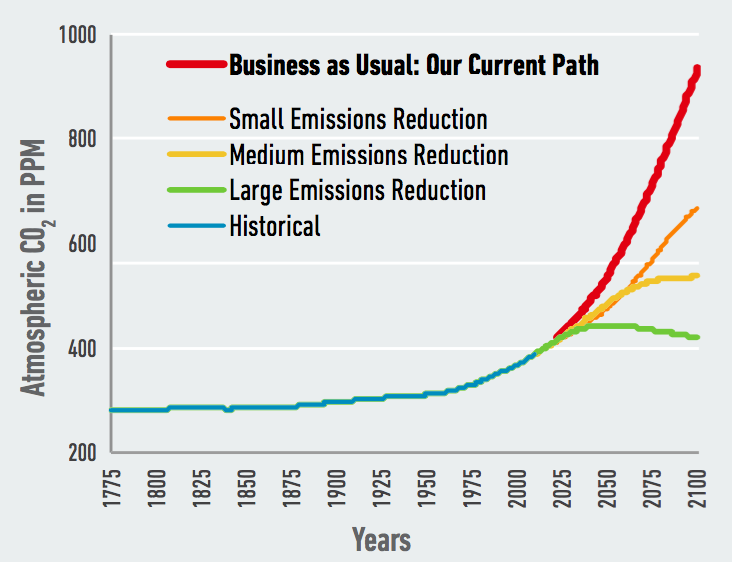
This follow-up report focuses on California and explores some of the likely economic consequences to the state of continuing on our current greenhouse gas emissions pathway,1 with no significant new national policy or global action to mitigate climate change.

Our research combines state-of-the-art climate science projections through the year 2100 (and beyond in some cases) with empirically-derived estimates of the impact of projected changes in temperature and precipitation on the California economy. We analyze not only those outcomes most likely to occur, but also lower-probability, higher-cost climate impacts. These “tail risks” are most often expressed here as the 1-in-20 chance events.

Our findings show that if we stay on our current global emissions pathway, California will likely face multiple and significant economic risks from climate change. However, if policymakers and business leaders act now to reduce emissions and adapt to a changing climate, we can significantly reduce these risks.

Given California’s diverse geography and economy, the risks posed by climate change vary significantly by region. These risks include:

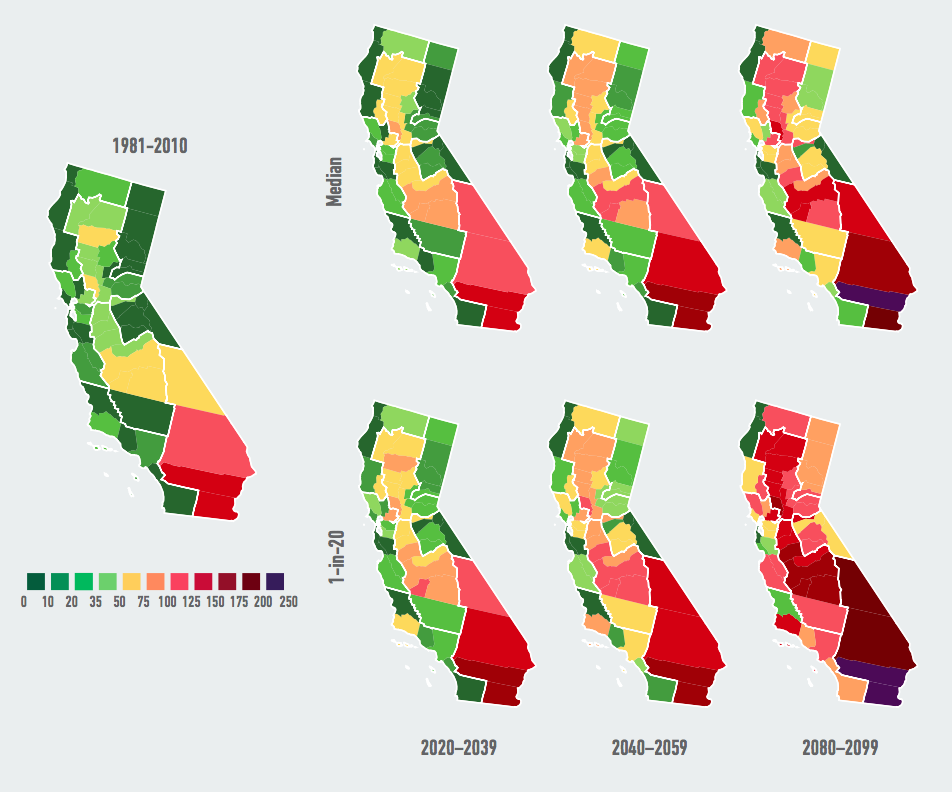
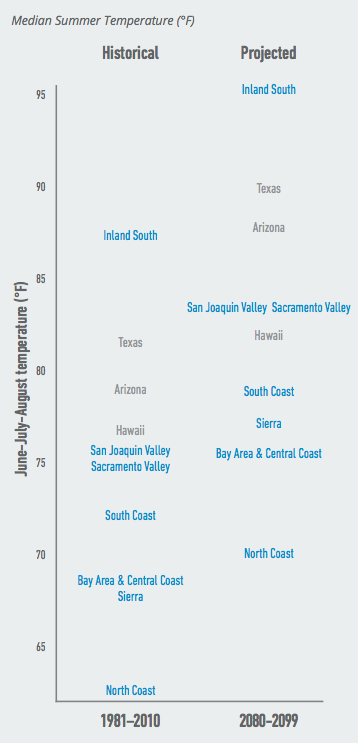
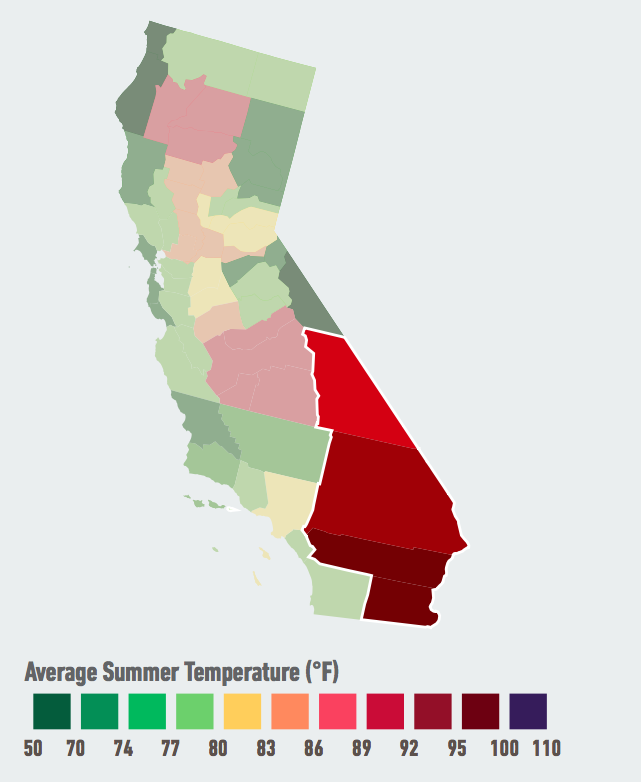
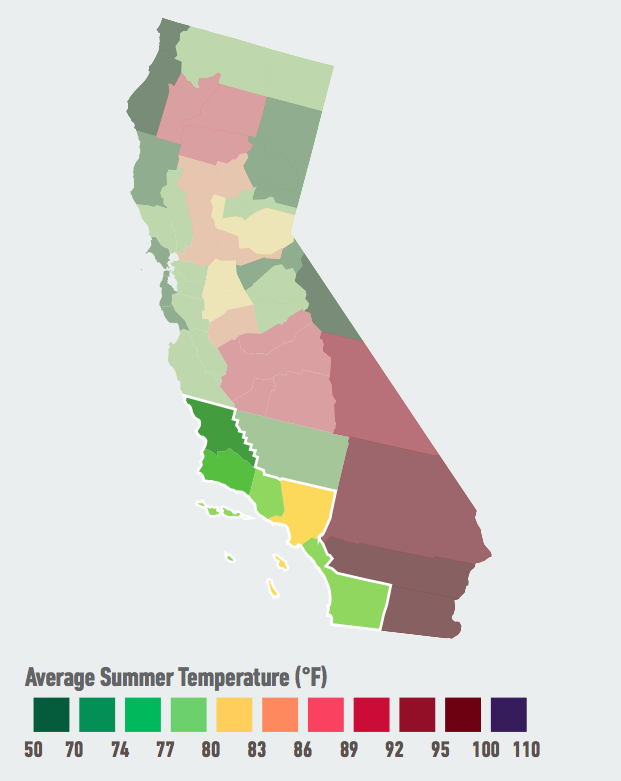
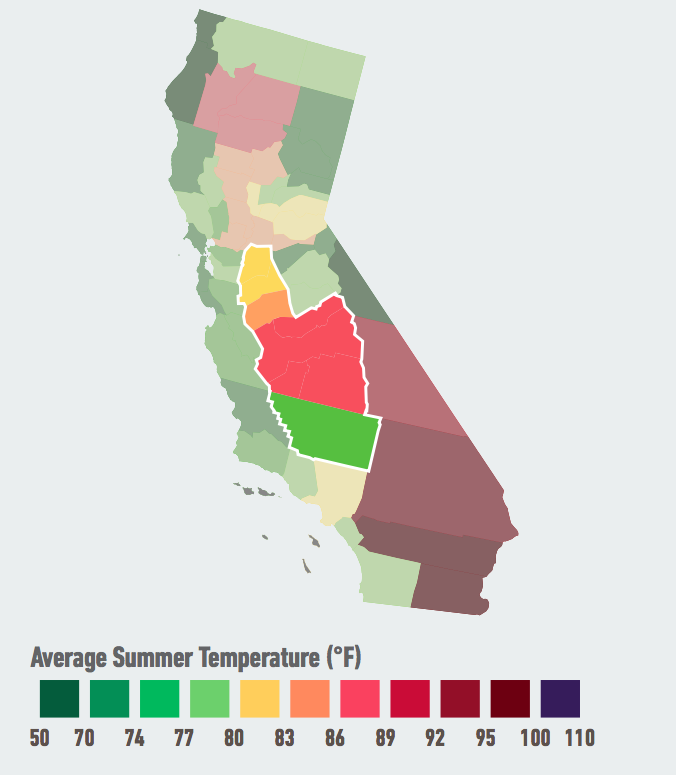
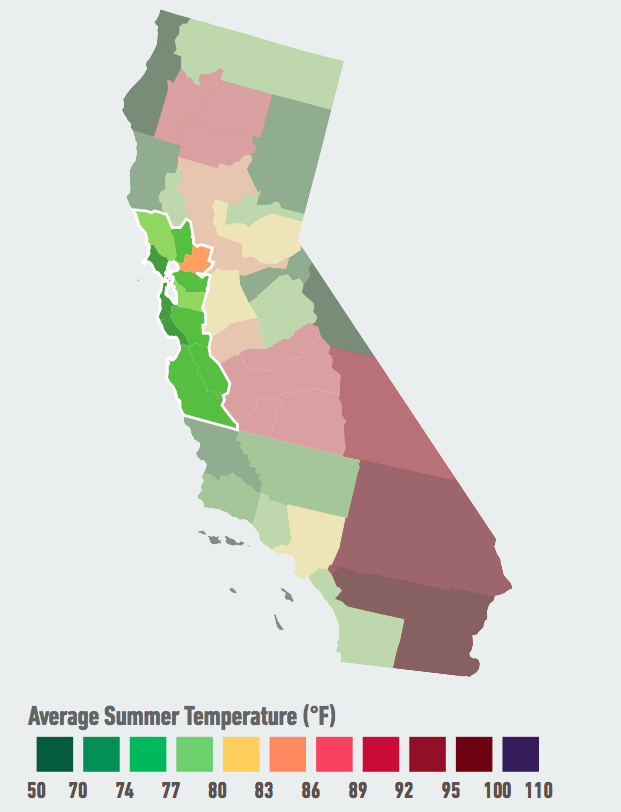
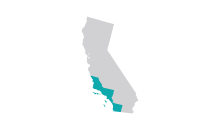
  • A dramatic increase in extreme heat across the state, especially in the San Joaquin Valley and Inland South regions
    • By the end of this century, summers in California will likely be hotter than summers in Texas and Louisiana today, and the average number of extremely hot days each year—with temperatures above 95°F—will likely double or even triple.
    • By mid-century, the San Joaquin Valley, which accounts for more than half of the state’s agricultural output, will likely experience 63 to 85 days over 95°F each year compared to an average of 44 such days per year over the past 30 years. By the end of the century, the number of extremely hot days will likely increase to three to four full months per year.
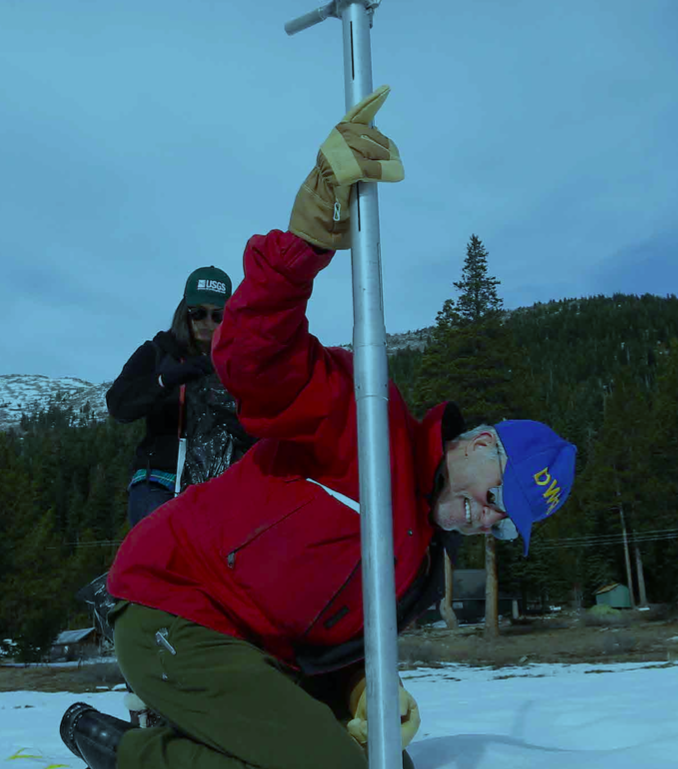
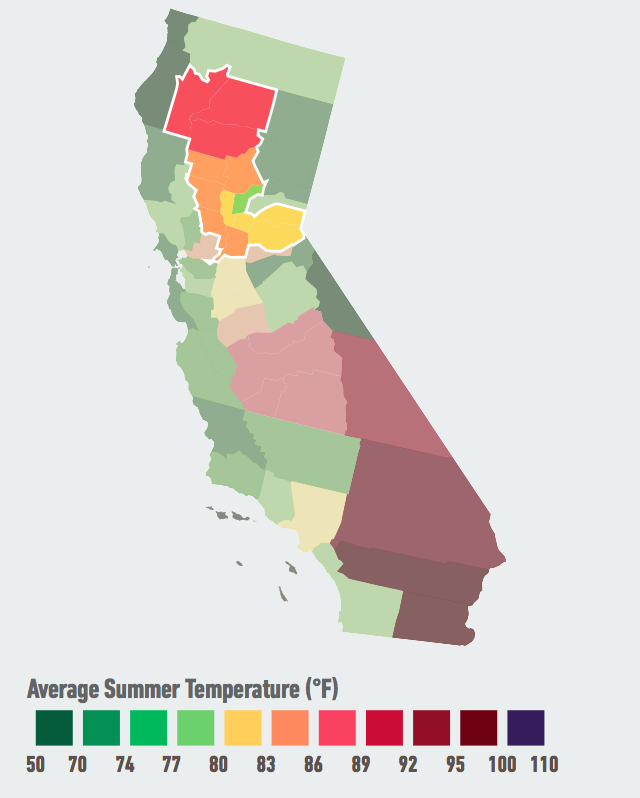
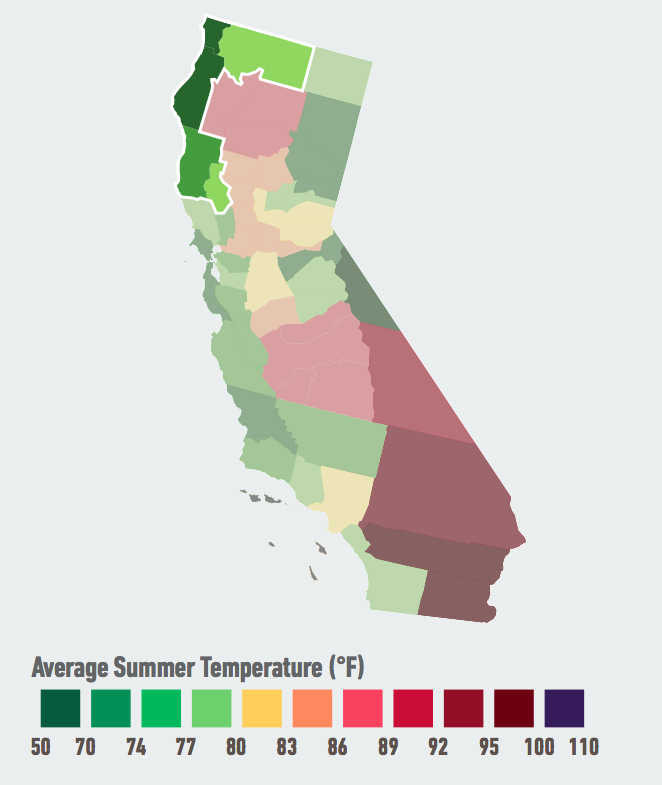
    • Meanwhile, a likely 60% to 90% decline in the annual average number of days below freezing statewide is expected to reduce snowpack, affecting state water supplies along with winter tourism and recreation.
  • Changes in the timing, amount, and type of precipitation in California, which could lead to increased drought and flooding and put the reliability of the state’s water supply at risk
    • Warming temperatures will cause California to see a shift in precipitation from snow to rain, as well as a change in the timing of snowmelt.
    • Most regions in California will likely see a decrease in fall and spring precipitation. The majority of precipitation will continue to fall during the winter, but increasingly more as rain than snow.
    • These changes will impact California’s snowpack—a major water reservoir for the state—and affect the freshwater supply for multiple industries and communities.
    • California should also expect to see more heavy storms, which could increase the number and severity of floods in parts of the state, and longer dry spells between storms. The risk of drought could increase as well, especially given more extreme temperatures.
    • Changes in precipitation, combined with rising temperatures, could also have serious consequences for California’s water quality.
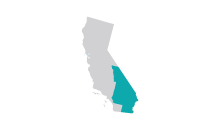
  • Widespread losses of coastal property and infrastructure due to sea-level rise along the California coast
    • If we continue on our current path, between $8 billion and $10 billion of existing property in California will likely be underwater by 2050, with an additional $6 billion to $10 billion at risk during high tide.
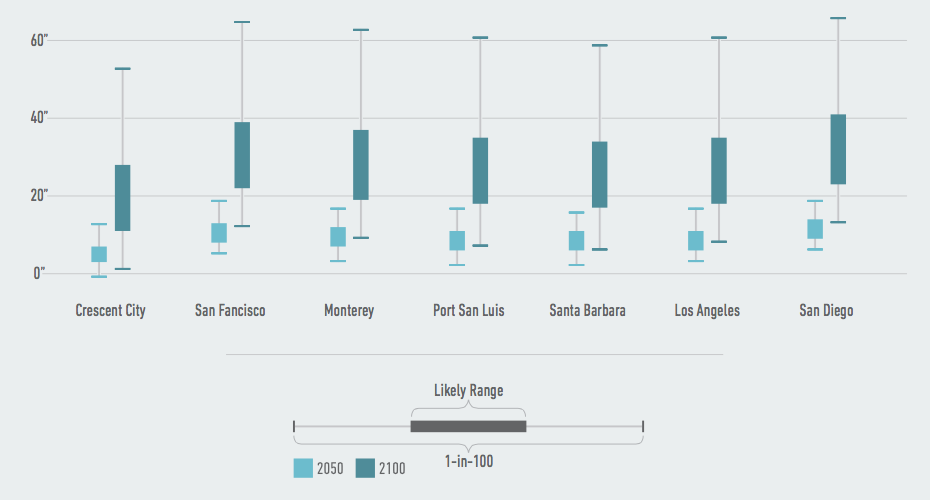
    • By 2100, $19 billion in coastal property will likely be below sea-level, with a 1-in-100 chance of more than $26 billion at risk.
    • In San Francisco, mean sea-level will likely rise 0.7 to 1.1 feet by 2050 and 1.8 to 3.3 feet by 2100. Meanwhile, San Diego will likely see sea-levels rise 0.8 to 1.2 feet by 2050 and 1.9 to 3.4 feet by 2100.
    • Rising tides could also damage a wide range of infrastructure, including water supply and delivery, energy, and transportation systems.
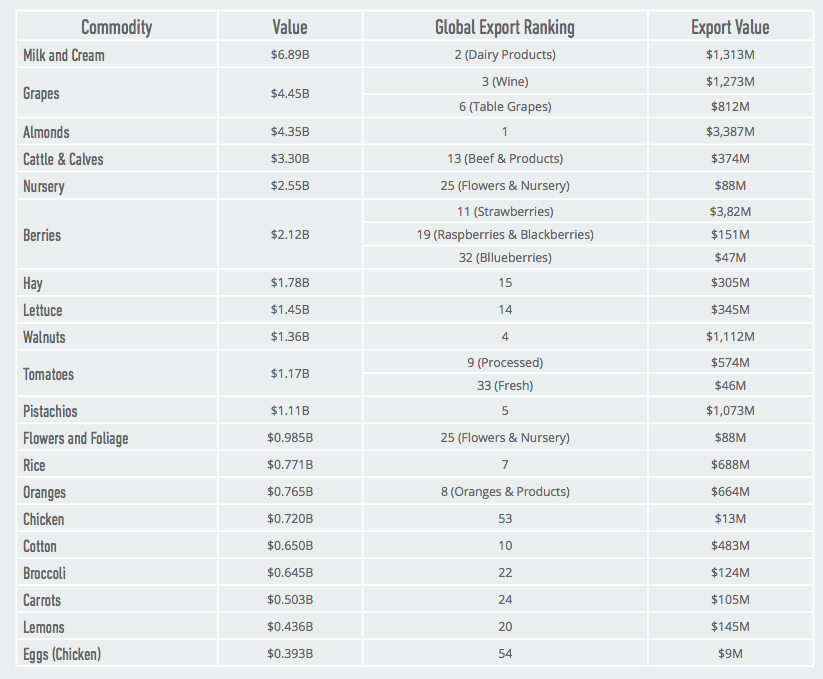
  • Shifting agricultural patterns and crop yields, with distinct threats to California’s varied crop mix of fruits, vegetables, nuts, and other highly valuable commodities
    • In 2012, California produced one-fifth of the nation’s supply of dairy, nearly two-thirds of its fruits and nuts, and over one-third of its vegetables.
    • California’s major crops, livestock, and dairy operations face distinct threats from climate-driven temperature variation across the state, which could have major repercussions on local and global markets.
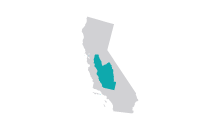
    • Without significant adaptation by farmers, several regions will likely see yield losses for heat-sensitive commodity crops like cotton and corn, with potentially high economic costs. For example, the Inland South region will likely take an economic hit of up to $38 million per year due to cotton yield declines by the end of the century.
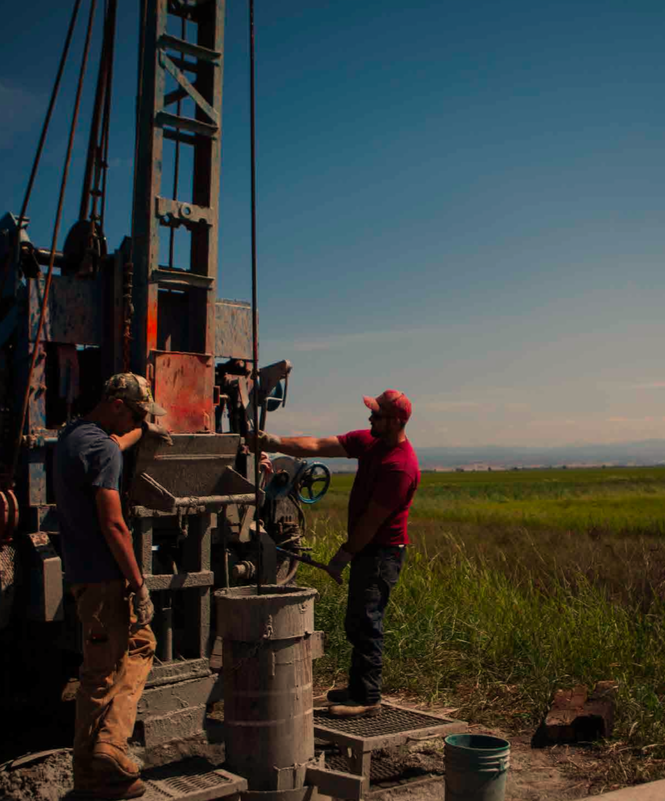
    • Climate-driven changes in water availability, quality, and timing could have a significant impact on California’s agricultural economy, which is heavily dependent on irrigation.
    • Changing climate conditions are expected to increase the spread of invasive pests and plant species and threaten livestock productivity.
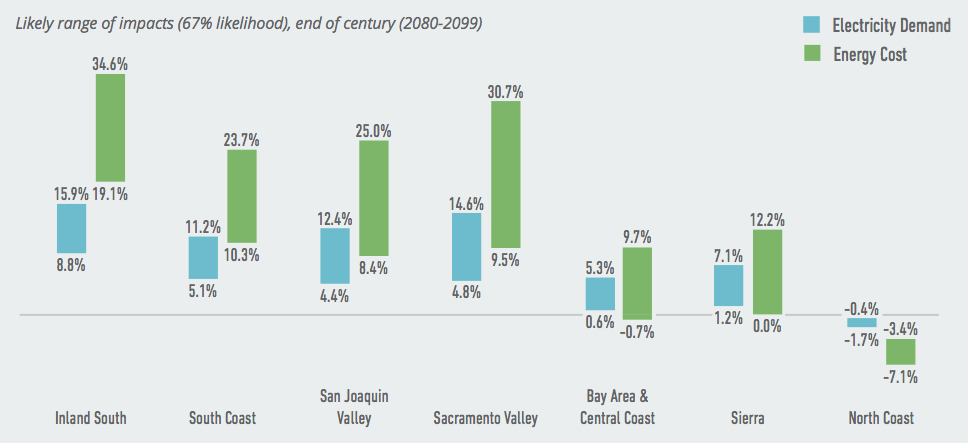
  • Increasing electricity demand combined with reduced system capacity, leading to higher energy costs
    • Rising temperatures will likely increase electricity use for residential and commercial cooling, driving up demand across the state.
    • Increasing heat, drought, and wildfires will stress California’s electricity infrastructure, decreasing the efficiency of the state’s centralized natural gas and nuclear power plants, jeopardizing hydropower generation, and disrupting transmission.
    • Building new capacity to meet additional electricity demand will result in significant increases in energy costs in some parts of the state. The Inland South region will be the hardest hit, with total energy costs likely to increase by up to 8.4% in the short term and as much as 35% by end of century.
  • Higher heat-related mortality, declining labor productivity, and worsened air quality
    • California will likely see up to 7,700 additional heat-related deaths per year by late century—more than twice the average number of traffic deaths annually in the state today.
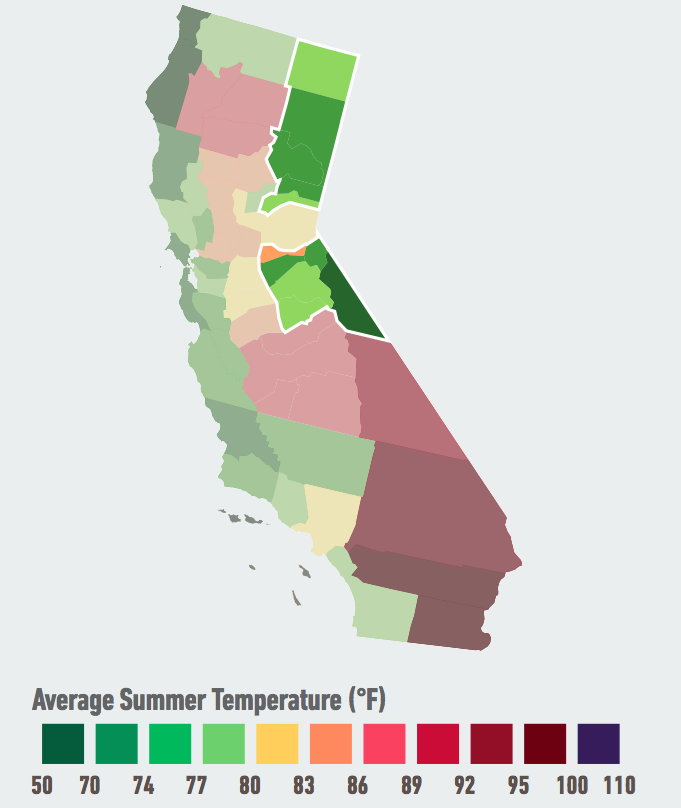
    • With 30% of California workers in “high risk” industries that are vulnerable to high temperatures, labor productivity is likely to decline across the state, most notably in the Sacramento and San Joaquin Valley regions.
    • Higher temperatures and more frequent wildfires will exacerbate ozone and particulate pollution in areas that already suffer from poor air quality, worsening respiratory health problems and increasing hospitalizations, emergency room visits, and absences from work or school.

California is already taking aggressive action to address climate change. By fully understanding the climate risks the state faces if we stay on our current emissions path, California businesses and policymakers have the opportunity to become models of climate risk mitigation and resilience for the nation and the world.

Introduction

California’s economy has long been rooted in the state’s temperate climate and rich natural resources. Gold, oil, timber, and agricultural products helped make the state a global economic leader, in turn supporting growth in industries such as manufacturing, tourism, entertainment, and information technology.

The same risk-taking spirit that originally drew gold-seeking ‘49ers to the state endures in California’s constant innovation at the frontier of new markets and technological boundaries. The state is now home to more S&P 500 companies than any other state, leads the nation in venture capital, and boasts the world’s 8th largest economy.

But climate change—and the resulting high temperatures, volatile precipitation patterns, and rising sea-levels—may put California’s competitiveness at risk.

Porterville Water. East Porterville residents distribute water during drought after local wells run dry.

East Porterville residents distribute water during drought after local wells run dry.

The mission of the Risky Business Project is to quantify the economic risks to the United States from unmitigated climate change. Our inaugural report, Risky Business: The Economic Risks of Climate Change in the United States, highlighted these risks across every region of the country, with a focus on three sectors: agriculture, energy demand, and coastal infrastructure. We also looked at overarching issues such as changes in labor productivity and heat-related mortality.

This follow-up report focuses on California and offers a first step toward defining the range of potential economic risks to specific sub-regions and industry sectors in the state if we continue on our current greenhouse gas emissions pathway, with no significant new national policy or global action to mitigate climate change.

Our research combines state-of-the-art climate science projections through the year 2100 with empirically-derived estimates of the impact of projected changes in temperature and precipitation on the California economy. We analyze not only those outcomes most likely to occur, but also lower-probability, higher-cost climate futures. These “tail risks” are most often expressed here as the 1-in-20 chance events.

When assessing risk related to climate change, it is particularly important to consider outlier events and not just the most likely scenarios. Indeed, the “outlier” 1-in- 100 year event today will become the 1-in-10 year event as the earth continues to warm. Put another way, over time the extremes will become the “new normal.”

California has a vast and diverse geography. For this reason, our analysis divides the state into seven distinct regions, reflecting the state’s major economic and population centers and key climate zones. Climate conditions vary dramatically across these regions, as does the mix of economic activity. While this variation will benefit the state’s overall economic resilience to future climatic changes, it is also true that each region of the state has a different risk profile and capacity to manage climate risk.

As with classic risk analysis, our work does not take into account the wide range of potential adaptation strategies California’s industries and policymakers will surely pursue in the face of shifting climate impacts. These potential responses are frankly too varied and speculative to model with any certainty; they also may depend on policies and technologies not yet commercialized or even imagined. Rather, we present our estimate of the risks California will face if it maintains its current economic and demographic structure, and if businesses and individuals continue to respond to changes in temperature and precipitation as they have in the past.

Figure 1. Human society is structured around “normal” weather, with some days hotter than average and some colder. At the distant “tails” are extreme events such as catastrophic weather. Climate change shifts the entire distribution curve to the right: old extremes become the new normal, new extremes emerge, and the process continues until we take action. Source: Risky Business Project.

Human society is structured around “normal” weather, with some days hotter than average and some colder. At the distant “tails” are extreme events such as catastrophic weather. Climate change shifts the entire distribution curve to the right: old extremes become the new normal, new extremes emerge, and the process continues until we take action. Source: Risky Business Project.

How Extreme Weather Events Become the New Normal

Californians are not shy of taking on risk—in fact, the Golden State is known for its prowess in creating new, disruptive technologies to tackle tricky social and economic challenges. Understanding the climate risks faced by the state in the coming years offers a perfect opportunity for business and policy leaders to bring the same spirit of enterprise and entrepreneurship to the challenge of climate change.

Defining Risk

The risk of a future event can be described as the probability (or likelihood) of that event combined with the severity of its consequences. The combination of likelihood and severity determines whether a risk is high or low. For instance, a highly likely event with minimal consequences would register as a moderate risk; a low-probability event, if it has potentially catastrophic impacts, could constitute a significant risk. These low-probability/high-impact risks are generally referred to as “tail risks.”

The Risky Business assessment evaluates a range of economic risks presented by climate change in the U.S., including both those outcomes considered most likely to occur and lower-probability climate futures that would be either considerably better or considerably worse than the likely range. This is a common risk assessment approach in other areas that have potentially catastrophic outcomes, including disaster management, public health, defense planning and terrorism prevention.

In presenting our results, we use the term “likely” to describe outcomes with at least a 67% (or two-in-three) chance of occurring. In discussing notable tail risks, we generally describe results as having a 1-in-20 chance (or 5%) of being worse than (or better than) a particular threshold. All risks described in this report represent average annual outcomes over one of three 20-year time periods: near-term (2020–2039), mid-century (2040–2059) and end of century or late-century (2080–2099).

Results: General California Trends

Given California’s sheer size and diverse geography and economy, the state faces multiple and significant risks from unabated climate change. These risks vary across the state, from north to south, coast to valley, mountain to desert. As a result of this wide geographical and climatic variation, there is no single top-line number that represents the cost of climate change to the California economy as a whole. For this reason, we have divided the state into seven regions, loosely grouped into the following three categories:2

  • The coastal regions—South Coast, Bay Area & Central Coast, and North Coast—tend to have more moderate temperatures than areas farther inland, but they are also vulnerable to the impacts of sea-level rise caused by warming oceans and melting land ice. The California coast is home to more than 85% of the state’s population3 and the majority of its largest businesses; coastal regions also generate the vast majority of the state’s Gross State Product (GSP).4
  • The Central Valley—including the Sacramento Valley and San Joaquin Valley regions—is known as one of the richest agricultural regions in the world, but is likely to face increasing challenges as a result of warmer and drier conditions.
  • The eastern edge of the state—including the mountainous Sierra range and the desert counties in the Inland South—is a haven for natural recreation and tourism, but a combination of warming temperatures and shifting precipitation patterns will permanently alter the region’s character.

Despite this regional variability, we can identify some general trends in how California will react to a changing climate. These include:

Increasing heat: Of all the climate-related impacts studied by scientists, increasing heat is the best understood. Californians currently enjoy a Mediterranean climate, characterized by cool, wet winters and warm, dry summers. However, by the end of this century, summers in the state will likely be hotter on average than summers in Texas and Louisiana today. The average Californian will likely experience two to three times more extreme heat days by century’s end—defined here as days with temperatures above 95°Fahrenheit—than have occurred annually over the past 30 years. The most dramatic increases will be in the San Joaquin Valley and the Sacramento Valley regions.

Figure 2. On our current path, California will likely see significantly more days above 95°F each year. Some regions will be hit far harder by extreme heat than others, and some will experience rising temperatures in terms of warmer winters rather than unbearable summers. But by the end of the century, the average Californian will likely see 59 to 94 days over 95°F per year compared to 32 such days on average over the past 30 years. Data Source: American Climate Prospectus.

On our current path, California will likely see significantly more days above 95°F each year. Some regions will be hit far harder by extreme heat than others, and some will experience rising temperatures in terms of warmer winters rather than unbearable summers. But by the end of the century, the average Californian will likely see 59 to 94 days over 95°F per year compared to 32 such days on average over the past 30 years. Data Source: American Climate Prospectus.

Average Days Over 95°F

Meanwhile, by century’s end the state will likely see a drop of 60% to 90% in the average number of days that dip below freezing. The Sierra region will see the largest likely decrease, from a current average of 88 days per year below 32°F, to likely as few as 25 such days by end of century. This will have a critical impact on the region’s snowpack, which is a vital natural water reservoir for the state.

Figure 3. Changing Summer Temperatures By Region. Data Source: American Climate Prospectus.

Changing Summer Temperatures By Region. Data Source: American Climate Prospectus.

Accelerated sea-level rise: Rising air temperatures will also warm the oceans and accelerate melting of land ice, affecting sea-levels along the California coast. More than one million Californians currently reside in coastal floodplains, and over 85% of California’s population lives in coastal counties. Given that at least 80% of California’s GSP is generated in these counties, the economic impacts of sea-level rise could be significant, especially when combined with storms and high tide events.

If we continue on our current path, between $8 billion and $10 billion of existing property in California will likely be underwater by 2050, with an additional $6 billion to $10 billion susceptible to flooding at high tide that is not at risk today. By 2100, the value of property below mean sea-level will likely grow to $19 billion, with $33 billion more at risk at high tide. There is a 1-in-100 chance that more than $26 billion worth of California’s coastal property will be underwater with more than an additional $68 billion vulnerable at high tide. Sea-level rise also puts a wide range of coastal infrastructure and water resources at risk.

Changes in water availability: In general, changes in precipitation due to a changing climate are harder to predict than heat-related impacts. However, we do know that rising temperatures will likely cause a shift in the type of precipitation, from snow to rain, and in the timing of snowmelt. California’s snowpack serves as a major water reservoir, with spring and summer snowmelt supplying water during the drier seasons to water-dependent industries like agriculture and to communities across the state. If we stay on our current path, precipitation levels in the spring and fall will likely decrease for every region in California by mid- to late-century. While the change in winter levels is less certain, the majority of precipitation will continue to fall during this season, but it may fall as rain rather than snow. Climate change will also increase the probability of precipitation extremes, and higher temperatures will speed evaporation from soils and reservoirs. All these climate-driven variations, working alone and in combination, will have a significant impact on the overall availability of fresh water to California businesses and communities.

Figure 4. Rising temperatures will warm the oceans and accelerate melting of land ice, affecting sea-levels along the California coast. Impacts of thermal expansion and melting mountain glaciers can be predicted with moderate confidence, but more uncertainty remains in the potential behavior of polar ice sheets. It is important to note that our estimates involve a particular set of assumptions about likely ice sheet behavior. However, positive feedback loops could accelerate melting significantly, for example in the West Antarctic Ice Sheet, leading to much higher sea-level rise. As a result, these feedbacks could render the tail probability outcomes more likely than we project. Data Source: Kopp and others 2014.

Rising temperatures will warm the oceans and accelerate melting of land ice, affecting sea-levels along the California coast. Impacts of thermal expansion and melting mountain glaciers can be predicted with moderate confidence, but more uncertainty remains in the potential behavior of polar ice sheets. It is important to note that our estimates involve a particular set of assumptions about likely ice sheet behavior. However, positive feedback loops could accelerate melting significantly, for example in the West Antarctic Ice Sheet, leading to much higher sea-level rise. As a result, these feedbacks could render the tail probability outcomes more likely than we project. Data Source: Kopp and others 2014.

Sea-level Rise

Declines in agricultural productivity: Increasingly hot and dry conditions over the course of the century will create significant challenges for California farmers and ranchers. Many of the state’s most valuable agricultural products (e.g., tree fruits, nuts, and livestock operations) face significant risks from increasing heat, changes in water availability, and timing and changes in the prevalence of pests, weeds, and diseases.

Increases in electricity demand and cost: Increasing heat will have a measurable effect on California’s electricity demand and energy costs as well. Energy demand is highly sensitive to warm temperatures, which result in increased use of electricity for residential and commercial cooling and reductions in heating demand. At the same time, higher temperatures reduce the efficiency of energy generation, transmission, and delivery systems. Statewide, electricity demand will likely increase 4% to 11%, and energy costs will likely increase between 9% and 22% by late century. The expected fluctuation of electricity demand and energy cost varies significantly across each region.

Constrained water resources may also decrease the availability of low-cost hydroelectric power generation, whereas coastal flooding brought about by rising sea-levels may affect a wide range of energy infrastructure in coastal areas.

Heat-related increases in mortality, and decreases in labor productivity: Rising temperatures will also affect human health, resulting in likely increases in heat-related mortality of up to 7,700 additional deaths statewide each year by end of century, and decreases in labor productivity in “high-risk” outdoor industries (such as construction, transportation, agriculture, and manufacturing) that make up 30% of California’s workforce.

As a state, California faces significant and diverse climate risks. But a full risk profile for the state requires a deeper dive into each region and sector, as we do in the next section.

Snowpack Echo Summit. Official surveying winter snowpack at Echo Summit, California.

Official surveying winter snowpack at Echo Summit, California.

Results by Region

To fully explore the regional variability of climate impacts in the state, we have divided California’s 58 counties into seven regions for individual analysis, as shown in Figure 5.

Figure 5. The seven regions are based on the state’s major economic and population centers and key climate zones. Data Source: Rhodium Group.

The seven regions are based on the state’s major economic and population centers and key climate zones. Data Source: Rhodium Group.

California Regions

Of course, none of these regions is economically or culturally isolated from the others; rather, they are connected to each other by extensive energy, transportation, and water infrastructure, and to the rest of the nation and world through multiple global supply chains. Today California supplies the world with a huge variety of manufactured and agricultural products, ranging from fruits and vegetables to computers and electronic products, with total exports topping $168 billion in 2013.6

In exploring the economic risks from climate change in each of these regions, we focus primarily on their business sectors and workforce. However, these regions also include individual citizens and communities that will be particularly hard-hit by climate impacts because of their dependence on affected industries, their income levels, or their remote locations. These vulnerabilities are extremely important in thinking about climate resilience, but they are outside the scope of this report.

The following sections go into greater detail on climate impacts in California’s seven regions. Since climate change most clearly results in increasing heat, and the southern regions of the state are likely to experience the most severe heat-related impacts, we begin our discussion of regional impacts in southern California.

Inland South

Located in California’s southeastern quarter, the Inland South region7 is home to more than 4.5 million people and generated $144 billion in 2012, representing roughly 7% of Gross State Product (GSP).8

Inland South. On our current emissions path, residents of the Inland South region will be hit hardest by rising temperatures, with the average number of days over 95°F per year likely to increase from an average of 127 days over the past 30 years to 145 to 158 days by mid-century. Higher temperatures will likely increase electricity demand, more than in any other region, resulting in likely energy cost increases or 19% to 35% by end of century. Data Source: American Climate Prospectus.

On our current emissions path, residents of the Inland South region will be hit hardest by rising temperatures, with the average number of days over 95°F per year likely to increase from an average of 127 days over the past 30 years to 145 to 158 days by mid-century. Higher temperatures will likely increase electricity demand, more than in any other region, resulting in likely energy cost increases or 19% to 35% by end of century. Data Source: American Climate Prospectus.

AVERAGE SUMMER TEMPERATURE BY END OF CENTURY

The region is densely populated along its western half, where it adjoins the Greater Los Angeles metropolitan area, and consists of sparsely populated agrarian and desert communities in the east and south. Total agricultural output in the region in 2012 was over $3.5 billion and consisted primarily of milk, livestock, and alfalfa production.9 The region is also a popular tourist destination, home to Mt. Whitney—the highest point in the contiguous United States—and the Mojave, Joshua Tree, and Death Valley National Parks, as well as the Salton Sea.

Of all California regions, the Inland South will be the hardest hit by rising temperatures. The region already experiences an average of more than four full months (127 days) each year of days above 95°F, and will likely see up to an additional month of such days (145 to 158 days) by mid-century. By the end of this century, Inland South residents will likely experience these temperatures for 165 to 195 days, or about half the year. There is a 1-in-20 chance that the region will experience more than seven full months (214 days) of extremely hot days by end of century.

Impacts related to increasing heat in the Inland South include:

Rising energy costs: The Inland South will see the highest increases in electricity demand of any part of the state, with likely increases of 0.5% to 4% in the next 5–25 years, 3% to 7% by mid-century, and 9% to 16% by late century. There is a 1-in-20 chance of more than a 20% increase by the end of century. The corresponding cost increases are even more dramatic: in the short term, the region will likely see a 1% to 8% increase, soaring to an increase of 19% to 35% by end of century, with a 1-in-20 chance of more than a 43% increase.

Figure 6. Projected Change in Electricity Demand and Energy Costs by Region. Data Source: American Climate Prospectus.

Projected Change in Electricity Demand and Energy Costs by Region. Data Source: American Climate Prospectus.

Heat-related mortality: The region will likely see 2 to 15 additional deaths per 100,000 residents each year by mid-century (up to 700 additional deaths, assuming the current population size10). By late century, the Inland South will likely see 14 to 36 additional deaths per 100,000—or as many as 1,600 additional deaths each year—with a 1-in-20 chance of more than 50 additional deaths each year per 100,000 residents (more than 2,300 deaths altogether).

Declines in labor productivity: Nearly 30% of the Inland South’s workforce is in high-risk outdoor industries, such as agriculture and construction, which will face additional costs as labor productivity decreases. By end of century, labor productivity will likely decline by as much as 2.2% in these industries, with 1-in-20 chance of a decrease of more than 2.9%. This tail risk is comparable to the decline in absolute labor output during past U.S. recessions.11

South Coast

With nearly 18 million residents, most living in and around Los Angeles, the South Coast region12 is California’s primary population center and a hub of global commerce.

South Coast. On our current emissions path, residents of the South Coast region will see the average number of days over 95°F per year likely increase from an average of only 13 over the past 30 years to 19 to 30 by mid-century. Sea-level at San Diego, which is home to the largest naval base on the west coast, will likely rise by 1.9 to 3.4 feet by 2100, with a 1-in-100 chance of more than 5.5 feet. Data Source: American Climate Prospectus.

On our current emissions path, residents of the South Coast region will see the average number of days over 95°F per year likely increase from an average of only 13 over the past 30 years to 19 to 30 by mid-century. Sea-level at San Diego, which is home to the largest naval base on the west coast, will likely rise by 1.9 to 3.4 feet by 2100, with a 1-in-100 chance of more than 5.5 feet. Data Source: American Climate Prospectus.

AVERAGE SUMMER TEMPERATURE BY END OF CENTURY

The region is home to 24 Fortune 500 companies and contributes nearly half (over $1 trillion in 2012) of California’s GSP. The South Coast leads the state in numerous key industries, including manufacturing, tourism, and entertainment. The region also accounts for roughly 10% of the state’s total agricultural output (with a value of $4.4 billion), houses just under half the state’s manufacturing facilities,13 and contains three of the state’s top five oil producing counties.

The South Coast is also a logistical and transportation hub for much of the Pacific Rim and southwest United States. Long Beach and Los Angeles are home to the nation’s first and second largest ports respectively based on container traffic,14 which together handle 40% of the nation’s imports.15 The region also includes the nation’s third busiest airport (LAX), a vast network of interstate freeways, and the largest naval base on the west coast, in San Diego.

The South Coast region enjoys a temperate climate, with an average of only 13 days over 950F each year over the last 30 years. However, if we stay on our current path, the region will likely experience 19 to 30 extremely hot days by mid-century, and 35 to 71 such days by end of century.

Other South Coast impacts include:

Accelerated sea-level rise: San Diego is among the most vulnerable areas of the state to increased sea-level rise. Our analysis suggests likely sea-level rise of 1.9 to 3.4 feet along the city’s coast by 2100, with a 1-in-20 chance of over 4.1 feet and a 1-in-100 chance of more than 5.5 feet. San Diego has significant strategic importance to the U.S. military: the city is home to three Marine installations, including Marine Corps Base Camp Pendleton; three naval bases; and a Coast Guard station. All have significant coastal assets.

Los Angeles will likely see 0.5 to 0.9 feet of sea-level rise by 2050, and 1.5 to 2.9 feet by 2100, with tail risks of more than 3.7 feet (1-in-20) and over 5.1 feet (1-in- 100) of rise. Important water resources in the city and surrounding areas, including groundwater aquifers and estuaries, are at risk of contamination from rising seawater.16 Rising sea-levels will also accelerate coastal erosion, with potential effects for property and beach integrity and the region’s tourism industry.

Rising energy costs: Rising temperatures will likely increase electricity demand throughout the South Coast region by 5% to 11% by end of century, with a 1-in-20 chance of an increase of more than 15%. Higher demand for residential and commercial cooling will likely raise energy costs by 10% to 24% by late century, with a 1-in-20 probability of increased costs of more than 33%—a big jump for this manufacturing-intensive region.

Heat-related mortality: If we continue on our current emissions path, the South Coast region will likely experience as many as 20 additional deaths annually per 100,000 residents by late century. This translates to up to 3,500 additional deaths per year— almost half of the likely total increase statewide by century’s end. There is a 1-in-20 chance of more than 35 additional deaths per 100,000 residents, which would result in over 6,200 additional deaths each year by late century.

San Joaquin Valley

The San Joaquin Valley17 is home to four million Californians and boasts an overall economy that totaled $141 billion in 2012.

San Joaquin Valley. On our current emissions path, residents of the San Joaquin Valley region will see the average number of days over
95°F per year likely increase from an average of 44 over
the past 30 years to 63 to 85 by mid-century. Among other effects, rising temperatures may affect the Valley’s robust agricultural sector, resulting in reduced crops yields. For example, by end of century, the region will face likely declines in corn yields of 10% to 43%—unless farmers employ new adaptive practices. Data Source: American Climate Prospectus

On our current emissions path, residents of the San Joaquin Valley region will see the average number of days over<br /> 95°F per year likely increase from an average of 44 over<br /> the past 30 years to 63 to 85 by mid-century. Among other effects, rising temperatures may affect the Valley’s robust agricultural sector, resulting in reduced crops yields. For example, by end of century, the region will face likely declines in corn yields of 10% to 43%—unless farmers employ new adaptive practices. Data Source: American Climate Prospectus

Major cities in the region include Fresno, Bakersfield, Modesto, and Stockton. This region is among the richest agricultural areas in the world: it is home to eight of the top 10 agricultural counties in the state, and accounts for more than half of California’s agricultural output. Among the hundreds of agricultural commodities produced in the San Joaquin Valley, milk, almonds, grapes, and livestock are the largest by value.

The region is also a major energy producer, the source of 75% of the state’s oil production and 65% of its gas production.18 Kern County is the third most productive oil-producing county in the U.S.,19 accounting for one-tenth of overall U.S. oil production and three of the five largest U.S. oil fields.20 Kern is also home to the world’s second largest onshore wind farm, the Alta Wind Energy Center,21 and construction is underway there on what will be the world’s largest solar PV installation, at Antelope Valley.22

The San Joaquin Valley, already warmer than much of the state, is likely to experience far more extremely hot days each year over the coming decades. By mid-century, the number of days in the region above 95°F will likely double from current averages, rising to 63 to 85 days by mid-century, and to 90 to 133 days—three to four full months of extreme heat—by century’s end. There is a 1-in-20 chance of more than 153 such days per year by late century. Increasing heat may heighten the region’s vulnerability to wildfire along its eastern boundary, which includes parts of Kings Canyon and Sequoia National Parks, as well as the Sierra National Forest.

Winters in the region will also become warmer, with potential consequences for temperature-sensitive crops such as almonds, peaches, and other stone fruits; we will later discuss such agricultural impacts in more detail. As temperatures increase, the San Joaquin Valley will likely see a decrease in days below freezing from a historical average of 31 days to as few as 16 days by mid-century, and down to as few as five such days by late century.

Increasing temperatures will also likely heighten the following risks:

Heat-related mortality: State officials estimate that California’s July 2006 heat wave resulted in 300–450 premature deaths, and possibly up to 650 deaths across nine counties, with the majority concentrated in Fresno, Stanislaus, San Joaquin, and Kern.23 If we stay on our current path, heat-related deaths in the region will likely increase by 2 to 20 per 100,000 (more than 800 deaths annually) by late century, with a 1-in-20 chance of 35 additional deaths per 100,000 (1,400 additional deaths annually).

Declines in labor productivity: More than a third of the region’s total workforce is in high-risk industries, such as energy production, agriculture, and construction. These industries will likely face productivity declines of up to 2.2% by the end of this century, with a tail risk of 3.1% over the same period.

Rising energy costs: On our current emissions path, electricity demand from increased cooling in this region will likely rise by 4% to 12% by end of century. Despite lower demand for heating as a result of warmer winters, the cost of energy will likely increase by 8% to 25% by the end of this century, with a 1-in-20 chance that energy costs will increase by more than 32%.

Drought in California: Now and in the Future

Californians are familiar with water shortages, but the current drought is the most severe on record, with 2014 registering as the state’s warmest year since 1895 and one of its driest.24 The state’s businesses and residents are bearing the weight of severe water shortfalls: San Joaquin Valley residents saw their faucets run dry last year as the drought desiccated their wells, and the state’s agricultural industry has been hit particularly hard with the greatest reduction in surface water availability the sector has ever seen. Models project that total statewide costs from the drought could be as high as $2.2 billion, including lost revenue and ground-water pumping costs, with job losses of more than 17,000.25 In February 2015, with no end to the drought in sight, the U.S. Bureau of Reclamation announced that most Central Valley farms would face the second straight year without water from the federal Central Valley Project.

Researchers are investigating the impact of climate change on the probability of droughts across the western United States. We know that extreme temperatures can increase the severity of droughts26 by increasing evaporation from soils and reservoirs, altering the form of precipitation from snow to rain, and causing earlier snowmelt and a reduced snowpack. Climate change intensifies these impacts.27 While there is no clear long-term trend in the state’s annual precipitation due to climate change,28 there is evidence that rising temperatures are already increasing the likelihood of drought conditions in the Golden State. A new study that examined the role of temperature in California’s droughts over the past 120 years found that severe droughts were more likely to occur when dry conditions coincided with warmer temperatures. Over the past two decades, the number of dry-warm years has nearly doubled, in large part due to consistently rising temperatures. Warmer temperatures resulting from climate change will further increase the probability of dry-warm years over the next few decades so that when a low precipitation year does occur, it will almost certainly also be extremely warm.29 Another recent analysis found that the risk of a multi-decadal drought (or ‘mega-drought’) in the Southwest, which includes California, will likely increase from less than 12% historically (1950-2000) to 80% or more during the second half of this century (2050-2099) as higher temperatures and changing precipitation combine to reduce soil moisture. These future mega-droughts will likely be drier than previous mega-droughts in the region over the past millennium.30

The impact of climate change on the amount, timing, and location of precipitation is less clear. There is growing evidence that climate change will increase the probability of heavy precipitation events. It will also likely lower average precipitation levels in the spring and fall in California. In addition, recent studies show that the 2013–2014 drought was likely due in part to a persistent ridge of high atmospheric pressure off the West Coast. Coined the “Ridiculously Resilient Ridge” by Stanford University scientists, it deflected storms northward, leaving California without much needed precipitation.31 Multiple studies have found that climate change is increasing the probability of these unusual atmospheric events.32

Sacramento Valley

The Sacramento Valley spans 12 counties and includes a wide variety of terrain, ranging from the Sierra foothills and mountains in the north and east, to fertile farmland and delta in the south and west.33

Sacramento Valley. On our current emissions path, residents of the Sacramento Valley region will see the average number of days over 95°F per year likely increase from an average of 38 over the past 30 years to 59 to 72 by mid-century. Higher temperatures will likely raise electricity demand and energy costs, decrease labor productivity, and increase heat-related mortality over the course of the century. Data Source: American Climate Prospectus.

On our current emissions path, residents of the Sacramento Valley region will see the average number of days over 95°F per year likely increase from an average of 38 over the past 30 years to 59 to 72 by mid-century. Higher temperatures will likely raise electricity demand and energy costs, decrease labor productivity, and increase heat-related mortality over the course of the century. Data Source: American Climate Prospectus.

Average Summer Temperature By End of Century

Nearly three million Californians live in the Sacramento Valley, powering a regional economy that generated $132 billion in 2012. The region includes large swaths of some of the state’s most critical watersheds, including the American and Sacramento Rivers and their tributaries. The Sacramento Valley is also home to the state’s largest dam, at Lake Oroville, and is a hub of the State Water Project, which supplies Central and Southern California.

In part due to its proximity to the Sacramento-San Joaquin Delta, the Sacramento Valley is a rich agricultural region, producing $3.7 billion worth of output annually, or close to 10% of the state’s agricultural total. The region’s primary agricultural products include walnuts, rice, almonds, wine grapes, and dairy.34 Tourism is another notable industry in this region, which contains popular attractions such as Lake Tahoe. We discuss the potential economic impact of increasing temperatures and shifting precipitation trends on California’s winter recreation industry in greater depth later in the report.

Residents of the Sacramento Valley, which includes the state’s capital city of Sacramento, are accustomed to warm summers. The region currently experiences about five weeks (38 days) per year with temperatures above 95°F, but the heat is likely to grow more intense and last much longer by the middle and latter parts of this century. The region will likely see 45 to 52 days (an additional one to two weeks) that are extremely hot each year in the next 25 years, and 54 to 72 such days— up to an additional full month and twice as many as the current average—each year by mid-century. By the end of this century, the region will likely experience 80 to 119 days, or as many as four full months, each year at temperatures above 95°F.

Increasing temperatures in the region also mean fewer cold days and nights, with potential consequences for a range of industries including agriculture and winter recreation. The number of freezing days across the region will likely decrease from a historical average of 12 days per year, down to three to nine days by mid-century, and just one to three days below freezing on average each year across the region by late century.

Sacramento River. The Sacramento River in Sacramento, California

The Sacramento River in Sacramento, California

Other significant risks in the Sacramento Valley include:

Rising energy costs: If we stay on our current emissions path, the Sacramento Valley is likely to see significant increases in electricity demand and energy costs. Demand will likely increase by 1% to 5% by mid-century and 5% to 15% by late century, likely raising energy costs by 1% to 9% by mid-century and as much as 10% to 31% by late century. There is a tail risk of more than a 37% increase in energy costs in the region by century’s end.

Heat-related mortality: As temperatures increase across this region, so will the numbers of heat-related deaths. The likely range spans three to 26 additional deaths annually per 100,000 people (up to 750 additional deaths in total) by end of century, with a 1-in-20 chance of more than 43 additional deaths per 100,000 people, or 1,250 additional deaths per year.

Declines in labor productivity: Increasing temperatures will also decrease the productivity of the nearly 20% of the Sacramento Valley region’s workers in high-risk industries, such as agriculture, construction, and manufacturing. The region will likely experience decreases in labor productivity for these industries of 1% to 2.2% by late century, with a 1-in-20 chance of a decrease of more than 2.9% over the same period.

Sacramento-San Joaquin River Delta and Climate Change

East of the San Francisco Bay and just south of California’s capitol city sits a hub of the state’s elaborate water system, the Sacramento–San Joaquin River Delta. This confluence of two of California’s largest rivers forms the West Coast’s largest estuary with hundreds of wildlife species. It is also a source of freshwater for more than 25 million Californians and millions of acres of farmland via the State Water Project and the Central Valley Project, which supply water for urban and agricultural uses to the Valley, Southern California, and the Bay Area & Central Coast regions. It’s already a challenge to meet the state’s numerous (and often competing) demands for freshwater while preserving the health of the Delta’s ecosystems and fisheries. Saltwater intrusion from the Pacific Ocean, which is likely to become more of an issue due to rising sea-levels, is another factor that can exacerbate these tensions.

Rising sea-levels—particularly when combined with storm events—are just one of several factors that could endanger the integrity of the Delta’s 1,100 miles of earthen levees, which protect the state’s water supply and the region’s agricultural, transportation, and energy systems from flooding and saltwater intrusion.35 Earthquakes, land subsidence, and floods present serious threats to the aging levees as well. A levee failure could be costly, flooding valuable land that already sits below sea-level. For example, almost 12,000 acres of farmland flooded due to a breach in the Jones Tract levee in 2004,36 costing nearly $90 million to repair. Moreover, a levee failure could allow saltwater to mix with the Delta’s freshwater, increasing the salinity levels of water supplies and harming the local aquatic ecosystems. If the salinity levels become too high, the water export pumps in the Delta could be shut down.37

Even absent levee failures, saltwater will creep further inland from the San Francisco Bay into the Delta as sea-levels continue to rise. In response, water managers will need to release more freshwater into the Delta from upstream reservoirs in order to “push back” the salinity, especially during the warmer and drier months when freshwater withdrawals from the Delta tend to be higher. This will be further compounded by reductions in freshwater inflows from the Sacramento and San Joaquin Rivers during the spring, which will allow more time for saltwater intrusion. A recent study found that saltwater intrusion into the Delta could reduce the amount of freshwater for drinking and irrigation by up to one-quarter by the century’s end.38

Bay Area and Central Coast

Home to San Francisco and Silicon Valley, the Bay Area & Central Coast region is the state’s epicenter for finance and innovation in information technology, with more Fortune 500 companies than anywhere else in the state. Nearly 8.1 million people live in its 12 counties,39 which include three of California’s largest cities: San Francisco, San Jose, and Oakland.

Bay Area & Central Coast. On our current emissions path, residents of the Bay Area and Central Coast region will see the average number of days over 95°F per year likely increase from an average of only 12 over the past 30 years to 20 to 29 by mid-century. Sea-level at San Francisco will likely rise by 1.8 to 3.3 feet by 2100, with a 1-in-100 chance of more than 5.4 feet. Data Source: American Climate Prospectus.

On our current emissions path, residents of the Bay Area and Central Coast region will see the average number of days over 95°F per year likely increase from an average of only 12 over the past 30 years to 20 to 29 by mid-century. Sea-level at San Francisco will likely rise by 1.8 to 3.3 feet by 2100, with a 1-in-100 chance of more than 5.4 feet. Data Source: American Climate Prospectus.

AVERAGE SUMMER TEMPERATURE BY END OF CENTURY

The region is also home to some of the world’s most productive farmland. In the northern part of the region sit the world-renowned Napa and Sonoma Valley vineyards; the southern counties, including Santa Cruz and Monterey, produce large amounts of specialty fruits and vegetables such as strawberries, artichokes, and garlic. This region generated $621 billion in 2012, or 30% of the state’s GSP, including more than one-sixth of statewide agricultural output. It is a major transportation hub as well, with three international airports and four ports including the Ports of Richmond and Oakland, with an annual trade value of $41 billion.40 As a result, climate impacts felt here may reverberate across national and international trade routes and supply chains.

Because of its coastal location, the Bay Area & Central Coast region’s summer and winter temperatures have historically been more moderate than areas further inland. Over the past 30 years, this region has experienced only 12 days over 95°F each year on average. If we continue on our current emissions path, it will likely see an increase to 16 to 20 such days in the near term, 20 to 29 extremely hot days by mid-century, and 32 to 65 days over 95°F—more than two months—each year by century’s end. There is a 1-in-20 chance this region will experience more than 73 extremely hot days each year by late century.

Healdsburg. A vineyard worker picks grapes near Healdsburg, California.

A vineyard worker picks grapes near Healdsburg, California.

Higher temperatures will likely bring the following risks to the Bay Area & Central Coast region:

Accelerated sea-level rise: If we stay on our current emissions path, mean sea-level at San Francisco and the nearby locations of Monterey and Point Reyes will likely rise 0.7 to 1.1 feet by mid-century, and 1.8 to 3.3 feet by 2100. There is a 1-in-100 chance that San Francisco will see sea-level rise of more than 5.4 feet by 2100. Extensive development along San Francisco Bay places billions of dollars of property and infrastructure at risk, including the headquarters of numerous technology companies in the South Bay area, along with the San Francisco and Oakland airports.41 Portions of the bay shoreline that were previously filled in for the sake of development, such as Treasure Island and Mission Bay, are particularly vulnerable to rising seas that affect groundwater levels, causing land subsidence and increased susceptibility to liquefaction.42

Rising energy costs: Like other regions in California, the Bay Area & Central Coast will likely see increases in electricity demand over the course of the century primarily due to higher use of air conditioning. At the same time, the region will see a decrease in demand for heating (which can be supplied both by electric and nonelectric sources, such as natural gas), resulting in modest overall electricity demand increases of 1% to 5% by the end of the century. Energy costs may not rise proportionally since the balance of heating fuels will change, resulting in a range of likely cost outcomes by end of century: from a 1% decrease to a 10% increase, with a 1-in-20 chance of more than an 18% increase.

Sierra

Home to such destinations as Yosemite National Park, Mono Lake, and Mammoth Lakes, the Sierra region is renowned for its rugged mountains and stunning landscapes.

Sierra. On our current emissions path, residents of the Sierra region will see the average number of days over 95°F per year likely increase by five- to 10-fold by late century. At the same time, the region will see the average number of days below 32°F likely decrease from the historical average of 88 days per year to 52 to 74 by mid-century—the biggest decrease in the state. Rising temperatures threaten the region’s snowpack, a critical factor in statewide water availability and the region’s winter recreation industry. Data Source: American Climate Prospectus.

On our current emissions path, residents of the Sierra region will see the average number of days over 95°F per year likely increase by five- to 10-fold by late century. At the same time, the region will see the average number of days below 32°F likely decrease from the historical average of 88 days per year to 52 to 74 by mid-century—the biggest decrease in the state. Rising temperatures threaten the region’s snowpack, a critical factor in statewide water availability and the region’s winter recreation industry. Data Source: American Climate Prospectus.

AVERAGE SUMMER TEMPERATURE BY END OF CENTURY

Tourism and outdoor recreation are primary drivers of the local economy, valued at $11 billion in 2012; farming, ranching, livestock, and timber contrib- ute to a lesser extent. With less than one person per acre on average across its 11 counties,43 the region is one of the least populated in California. However, the rest of California depends heavily on the Sierra region as its primary source of winter snowpack, which serves as a critical natural freshwater reservoir for the state.

If we stay on our current emissions path, the Sierra region will likely experience significant increases in extremely hot days as a result of climate change, with a five to 10-fold jump in days by late century. The region’s current 30-year average for days over 95°F is roughly eight days per year, but this will likely increase to 13 to 19 days per year on average over the next 25 years, 21 to 33 days by mid-century, and 37 to 84 days–or nearly three full months–of extremely hot days by the end of this century. The tail risks are more significant: there is a 1-in-20 chance of more than 22 days per year of extremely hot days in the near term, 41 days by mid-century, and 103 days over 95°F each year by century’s end.

Rising wintertime temperatures are equally alarming, as they affect the region’s snowpack—a critical factor in statewide water availability and the region’s winter recreation industry. With nearly 24,000 people employed directly or indirectly by the winter tourism industry in California during the 2009/2010 season, the economic impacts of warmer temperatures on this region’s six major ski resorts and associated businesses could be significant.44 To date, the Sierra region has had the highest average number of days below 32°F among all California regions, with an average of 88 days per year over the past 30 years. Over the course of this century, freezing days will likely decline, to 69 to 81 days within the next 25 years (1-in-20 chance of less than 64 days), 52 to 74 days by mid-century (1-in-20 chance of less than 48 days), and just 25 to 51 days below freezing (1-in-20 chance of 18 days or fewer per year) by late century.

Other important likely climate risks to the Sierra region include:

Rising energy costs: Like other regions in California, the Sierra region will likely see overall increases in electricity demand over the course of the century primarily due to higher use of air conditioning. At the same time, the region will see a decrease in demand for heating (which can be supplied either by electric or nonelectric sources, such as natural gas), resulting in modest electricity demand increases of 1% to 7% by the end of the century. Overall energy costs may not rise proportionally since the balance of heating fuels will change, resulting in a range of likely cost outcomes by end of century: from no change relative to today to an increase of 12%, with a 1-in-20 chance of more than a 17% increase.

Declining labor productivity: Rising temperatures will likely reduce labor productivity in this region’s high-risk industries like construction by up to 1.8% by the end of the century (with a 1-in-20 chance of more than 2.6%). Nearly 20% of workers in the Sierra region are employed in these high-risk occupations.

Winter Recreation

There’s a reason climate change is often referred to as “global warming.” On our current emissions path, the northern parts of California will likely see up to a 41% drop in days below freezing by mid-century and up to 72% fewer freezing days each year by late century. Warmer winter temperatures may result in more of the state’s precipitation falling as rain instead of snow, with significant impacts for California’s $1.4 billion winter tourism industry. In fact, many businesses are already feeling the heat. Since the late 1970s, California has seen a 15% decrease in snowfall, with this precipitation falling as rain instead.45

Winter recreation is a major industry in California, with over 7.5 million visitors to the state’s ski resorts during the winter of 2009-2010. Combined with other winter sports such as snowmobiling, the ski industry contributed $787 million in labor incomes for 24,000 workers, including jobs at resorts and supporting industries such as dining and accommodations.46

But decreasing snowfall levels are directly affecting the industry and local economies: California has seen on average a 5% drop in the number of skier visits during low snowfall versus high snowfall years, resulting in almost 1,200 fewer jobs and a resort revenue difference of almost $100 million across the state.47 The Mount Waterman Ski Area near Los Angeles, for example, has been closed for the past four winters in a row, and even resorts that have stayed open have been struggling. The 2014/2015 season has faced similar challenges. Generally our wettest month, January brought almost no rainfall in 2015 to the northern part of the state, resulting in “dismally meager” snowpack, at only a quarter of the historical average.48

Snow-making can help make up for weather shortfalls, but not without significant added cost. The ski resort Squaw Valley, for example, spends about $90,000 for one weekend of snow-making, which requires pumping about 7,000 gallons of water per minute at a cost of $3,000 an hour.49 Snowmobiling and cross-country skiing are even more vulnerable than downhill skiing to temperature changes since they rely solely on natural snowfall, rather than snowmaking equipment.

On the other hand, warmer temperatures could have the benefit of expanding the use of ski areas for outdoor activities during the spring, summer, and fall, such as mountain biking, zip-lining, and hiking, and could present new business opportunities for these areas if owners are able to make the equipment and expertise adaptations necessary to completely alter business practices.

North Coast

Also known as the Redwood Coast, the North Coast region stretches from just north of the Bay Area all the way to the Oregon border. Its five counties are home to only 359,000 people, or an average of less than one person per acre, and generated $12 billion in 2012.50

North Coast. On our current emissions path, residents of the North Coast region will see the average number of days over 95°F per year likely increase from an average of only 11 over the past 30 years to 19 to 24 by mid-century. At the same time, the region will see the average number of days below 32°F likely decrease from the historical average of 46 days per year to 24 to 36 by mid-century. Sea-level rise at Crescent City will likely rise by 0.9 to 2.3 feet by 2100, with a 1-in-100 chance of more than 4.4 feet. Data Source: American Climate Prospectus.

On our current emissions path, residents of the North Coast region will see the average number of days over 95°F per year likely increase from an average of only 11 over the past 30 years to 19 to 24 by mid-century. At the same time, the region will see the average number of days below 32°F likely decrease from the historical average of 46 days per year to 24 to 36 by mid-century. Sea-level rise at Crescent City will likely rise by 0.9 to 2.3 feet by 2100, with a 1-in-100 chance of more than 4.4 feet. Data Source: American Climate Prospectus.

AVERAGE SUMMER TEMPERATURE BY END OF CENTURY

Agriculture—particularly wine grapes, livestock and dairy, nursery plants and products, and hay (alfalfa)—is an important sector for the region’s economy, totaling $710 million in output in 2012. The North Coast Region, which is heavily forested, is also the primary timber-producing region in the state. Humboldt County alone generates $63 million from timber, nearly one-quarter of the state’s entire timber value.51 Goods movement at the Port of Humboldt Bay, which is the only port between the Bay Area and Coos Bay, Oregon, is dominated by forest products and petroleum.52 With three national forest areas, numerous state parks, Mt. Shasta, and the Klamath River, outdoor recreation is another important economic driver for the region.

The North Coast will likely experience the smallest increase, in absolute terms, in days above 95°F among all California regions over the century—but this still translates to an increase of three-to four-fold over the current historical average. This region experienced 11 days of extreme heat each year on average over the past 30 years; this number is expected to grow, with 15 to 18 such days likely each year over the next 25 years, 19 to 24 days by mid-century, and 29 to 44 days over 95°F each year by late century. There is a 1-in-20 chance the region will experience more than 51 such days per year by end of century.

The North Coast typically sees the most average annual rainfall among all California regions.53 However, as temperatures rise and precipitation patterns change, the region’s valuable forests will face increased risk of forest fire. At the same time, after the Sierra, this region will see the largest likely decrease in the number of days below 32°F, from an average of 46 days over the past 30 years, to nine to 23 days below freezing by the end of the century. There is a 1-in-20 chance of fewer than five freezing days annually by late century. Warmer, drier conditions will also affect the region’s outdoor recreation industry across all seasons.

Climate-driven temperature increases will have additional impacts on sea-level rise and energy demand.

Accelerated sea-level rise: Mean sea-level at Crescent City will likely rise by an additional 0.9 to 2.3 feet by 2100, if we stay on our current path. There is a 1-in-20 chance of a rise of more than 3.1 feet, and a 1-in-100 chance of more than 4.4 feet. While large portions of the coastline are undeveloped, several cities (Crescent City, Arcata, and Eureka) lie in a coastal plain that is subject to flooding.54

Decreasing energy costs: The North Coast is unique among California regions in that warmer temperatures will likely bring decreases in electricity demand and energy costs. Unlike many other parts of the state, residents in this region rely more heavily on electricity than natural gas for heating.55 As temperatures rise, electricity demand for air conditioning will increase, but the reductions in gas-fueled and electric heating due to warmer winters will likely be larger. By mid-century, the North Coast will see a likely decrease of 0.6% to 1.4% in electricity demand and 0.4% to 1.7% decrease by late century. This translates into a likely decrease in energy costs of 2% to 5% and 3% to 7% by mid- and late-century, respectively.

Climate Change and Wildfire

Many variables, including human behavior and land development patterns, affect the frequency and severity of wildfires. However, a vast and growing body of evidence suggests that increasing temperatures and shifting precipitation patterns associated with climate change will result in more frequent and more intense wildfires in California.56 A recent scientific literature review found that “climate outweighed other factors in determining burned area in the western U.S. from 1916 to 2003,” and that California will experience increases of up to 74% in burned area as a result of increasing temperatures and other climate-related shifts by the end of this century.57 A similar analysis in California—one that presumed lower emission levels than the Risky Business Project assessment—projected increases in the number of large fires across the state of 58% to 128% above historical levels by 2085, leading to an increase in burned area of 57% to 169% over the same period.58

Warm, dry winters and early snowmelt runoff can create other damaging conditions in California’s forests, including tree disease and outbreaks of insects such as the Western and Mountain Pine Beetles, all of which make forests more flammable and fires more intense.59 These climate-related changes have contributed to the increasing number of large, costly fires in California, where seven of the 10 largest fires in state history
have occurred since 2001.60 The state already leads the Southwest region in wildfire-related economic costs, accounting for almost half of all annual firefighting expenditures in the Western United States, and California now has an annual fire suppression budget of over $1 billion.61

Climate Risks to California Agriculture

California has led the nation in agricultural output for over 50 consecutive years. In 2012, California produced one-fifth of the nation’s supply of dairy, nearly two-thirds of its fruits and nuts, and over one-third of its vegetables.

In fact, the state is the sole U.S. grower of numerous fruit, nut, and vegetable varieties—including almonds, artichokes, dates, grapes, kiwifruit, olives, clingstone peaches, pistachios, plums, pomegranates, and walnuts—many of which are shipped overseas. Overall, the state’s 80,500 farms directly employed roughly half a million people at harvest time and generated nearly $45 billion in output in 2012, as well as supporting at least $100 billion in related economic activity.62 California’s agricultural productivity is inextricably tied to climate conditions, and the industry’s success is of critical importance to the state, the nation, and the world.

The Risky Business Project original research focuses on two specific climate impacts, changes in heat and precipitation, and their interaction with the four major commodity crops which are the most ubiquitous nationwide: corn, soybeans, wheat, and cotton. However, California’s agriculture industry is oriented more toward production of fruit, nuts, vegetables, and dairy. While cotton is among the state’s top 20 crops, California grows relatively little corn, wheat, or soybeans. In contrast, fruit and nut varieties represented more than 40% (worth nearly $19 billion) of the state’s total agricultural output in 2012.63 Dairy was the state’s single highest-grossing agricultural commodity, at $6.9 billion in 2012. Grapes, almonds, and forage land used for hay (alfalfa) were the single most profitable crops, with a combined production value of over $13.7 billion.64

Because the dairy and specialty crop industries are an indispensable part of the state’s agricultural sector, we only briefly present quantitative results from the research underlying the Risky Business Project on the risks climate change presents to corn, cotton, and wheat, and then turn to a more qualitative discussion of potential climate impacts on specialty crops and the livestock sector.

As in a classic risk assessment, we did not model potential future adaptation into this analysis—that is, we assumed that growing seasons would be the same as they are now and did not account for specific adaptation measures, such as introducing irrigation in areas traditionally dependent solely on rainfall. Farmers are generally very quick to adapt to changing climate conditions; however, some adaptive measures may be cost-prohibitive or otherwise constrained by climate change effects that our research did not take into account. For instance, water resources for agricultural irrigation are expected to decrease and become more variable in California, regardless of the source,65 presenting both financial and practical challenges to the adoption of possible adaptation measures.

Risky Business Project Original Research: Major Commodity Crops

Overall, our research shows that California faces significant climate risks to its commodity crop output if we stay on our current greenhouse gas emissions pathway, but that these risks are extremely crop- and location-specific.

Plant growth is highly dependent on temperature: each crop species has a unique temperature threshold that defines its temperature range for optimal growth, outside of which crop yields can drop dramatically. Carbon dioxide (CO2) levels in the atmosphere can also affect crop growth in some cases. We took increased CO2 into account in our analysis, which is the main reason that certain crops (particularly wheat) exhibit potentially positive responses as emissions increase.

Cotton and corn are both strongly heat-sensitive, showing likely yield losses throughout this century. California produces the second highest yield of cotton per acre in the U.S., and the state’s cotton industry directly provides for over 20,000 jobs on farms, gins, warehouses, cottonseed oil mills, and textile mills.66 If we stay on our current emissions path, cotton in the Inland South region will see a likely decrease of 12% to 44% in yields by mid-century (with a 1-in-20 chance of more than a 55% decrease), and a 47% to 81% decline by late century (with a 1-in-20 chance of more than a 96% decline). The Sacramento and San Joaquin Valley regions are the only other areas of the state that grow cotton; these regions could see anything from a small increase to a larger decrease in cotton yields under the most likely scenarios, but even those regions face a 1-in-20 probability of significant cotton yield declines (for example, more than 24% in the San Joaquin Valley by mid-century, and more than 69% by the end of the century). These yield declines can result in high economic costs: for example, the Inland South region will likely take an economic hit of $22 million to $38 million per year due to cotton yield declines by the end of the century. The San Joaquin Valley faces much higher potential losses—likely up to $409 million per year, with a 1-in-20 chance of more than $657 million in annual losses—but could also see likely gains of up to $100 million annually from increased yields.

California’s corn production is concentrated in the San Joaquin Valley, where our estimates show likely yield declines of 2% to 17% by mid-century, and 10% to 43% by the end of the century, absent adaptation. On the other hand, wheat thrives under all of our modeled scenarios as a result of increased carbon dioxide fertilization and the fact that the majority of the wheat cultivated in the state is winter wheat, which is grown in the cooler months. For example, the San Joaquin Valley is likely to see a 6% to 14% increase in wheat yields by mid-century.

It is important to note that these outcomes do not account for the potential impacts of changes in water availability.

Effects of Rising Temperatures on Specialty Crops Including Fruits, Nuts, and Vegetables

California’s major crops of fruits, nuts, and vegetables face distinct threats from climate-driven temperature variation across the state. These crops are particularly sensitive to air temperatures at all stages in development, including during their resting or dormancy phase in winter months. Orchard crops such as grapes and citrus, for example, need to spend a certain amount of time at temperatures below 45°F (or “chilling hours”) each year in order to rest and prepare for the next season’s buds and flowers. Many of California’s highly profitable crops are perennial, requiring several years to reach maturity; their value is also determined by subjective factors including size, color, chemical composition, firmness, and aesthetic qualities, all of which can be compromised by relatively small temperature changes during critical development periods.

In California, the current geographic distribution of crops reflects their particular temperature preferences.67 As a result, expected decreases in the number of days below freezing severely threaten the 1.2 million hectares of chill-dependent orchards that fuel an $8.7 billion industry. Studies already show a reduction in win- ter chill hours in the Central Valley.68 This is exacerbated by an observed decrease in winter tule fog, a dense fog in the Valley that helps keep plant buds cool.69 Impacts to perennial crops are hard to model due to their slow growth and a lack of available data. However, of the few existing studies, one shows that cherries, for example, are “unambiguously threatened by warming,” with average yield decline projections of over 10% by 2040,70 even with carbon emissions kept at a level below the “business as usual” pathway.71 Almonds, too, are sensitive to warming and show a strong negative response to high February nighttime temperatures, which shorten the trees’ critical pollination period. And though gains during warmer springs and summers can potentially offset this effect, adaptation will be necessary to avoid harmful winter warming.72 For a state that produces 80% of the world’s almonds, even a small percent decline could have major repercussions on local and global markets. As an example, with the 2014 drought projected to continue well into 2015, growers are unwilling to sell this year’s crop, fearing that they may have an even smaller crop next year. Pinched supply combined with increasing global demand for almonds has sent prices flying to a nine-year high.73

But almonds aren’t the only California agricultural product in increasing global demand. Wine exports reached an all-time high in 2013.74 While wine grapes are not among the crops that suffer from temperature-induced yield decreases, heat can affect some of the grapes’ essential characteristics, including sugar concentration, which determines the alcohol content of the wine.75 Heat can also alter other characteristics, such as grape acidity, harvest time, color, and aroma, which are crucial for determining a wine’s quality and price.

While farmers are generally excellent adapters to climate conditions, California farmers may not be able to shift production of these heat-sensitive crops to cooler parts of the state. Those areas of the state least affected by extreme temperatures, such as the North Coast and Sierra regions, currently lack the transportation and food processing infrastructure that support the agricultural industry in the Sacramento and San Joaquin Valleys. Agricultural migration may also be limited by soil quality, irrigation infrastructure, and competing land uses. In addition, perennial crops require long-term commitment, since heavy investment of time and resources is required to bring these crops to maturity, presenting a unique risk for California farmers. Not only are many farmers unable to fallow and alternate specialty crops during hot, dry years, but the long time horizon of perennial crops slows the process of developing new varieties.

Moreover, areas that are suitable for a particular crop may become unfavorable during the life of a single orchard.76 It is important to note, however, that most studies on perennial crops do not take into account the fertilization effect of higher CO2 levels, since the magnitude of this effect on perennials is not well known. This effect could benefit farmers by boosting yields and reducing water use.77 At the same time, though, high ozone levels threaten to more than offset the gains from CO2 fertilization.78

Figure 7. California produces one-fifth of the nation’s supply of dairy and is the sole U.S. grower of numerous fruit, nut, and vegetable varieties, many of which are shipped overseas. Data Source: California Department of Food and Agriculture.

California produces one-fifth of the nation’s supply of dairy and is the sole U.S. grower of numerous fruit, nut, and vegetable varieties, many of which are shipped overseas. Data Source: California Department of Food and Agriculture.

Ranking of California Crops by Value & Export Value (2012)

Livestock

Increasing heat doesn’t only affect crop production; it also has a direct influence on livestock operations. Livestock and dairy are among California’s most valuable agricultural products: milk was California’s single most valuable commodity in 2012, generating $6.9 billion in output. Meanwhile, the state’s cattle farms produced $3.3 billion in output.79 For many livestock species, increased body temperatures of 4°F to 5°F above optimum levels can disrupt performance, production, and fertility, limiting an animal’s ability to produce meat, milk, or eggs. Higher temperatures can also increase animal mortality. Climate-controlled infrastructure for livestock can mitigate these effects, but at a cost—the resulting increases in energy use will raise operating costs, and the upfront investments may not be financially viable for small farms.

In addition, climate change can affect the price, quality, and availability of water, feed grains, and pasture, and change patterns of animal diseases. For example, the current drought has stunted the growth of grass feed-stocks and left many creek beds and watering holes dry. As a result, California ranchers have downsized their herds, sending cattle to neighboring states including Nevada, Texas, and Nebraska.80 Finally, any negative impact on crop productivity, especially for corn and other feedstocks grown in California and other parts of the U.S., could increase input costs (specifically feed costs) for livestock producers, putting additional pressure on that sector.81

Water Resources

Water availability, quality, and timing are likely the most important issues concerning California farmers, and these will be affected by climate change in myriad ways. A whopping 80% of human water use in the state currently goes towards irrigating nine million acres of farmland.82

Water supply differs by region: the Central Valley is snowpack and runoff dependent; the coastal regions rely on groundwater, water reuse, and reservoirs; and the Inland South depends on water from the Colorado River.

Higher temperatures and CO2 levels will have mixed effects on crop water use. Warmer temperatures are expected to increase crop water needs while rising CO2 levels may improve crop water use efficiency. Both effects are crop specific and highly interdependent. While studies have shown water conservation effects for rising CO2 levels in commodity crops such as wheat and soybeans, the interaction of higher temperatures and CO2 levels on perennial crops is not clearly understood.83

Meanwhile, predicted decreases in water availability due to reduced snowpack, early snowmelt, and changes in precipitation (see pages 43 to 45) are likely to fall disproportionately on agriculture.84 Because almost all of California’s agricultural land is irrigated (100% of land for vegetables and berries and 98% of land in orchards85), producers are vulnerable to volatility in cost and overall water availability. Greater weight is generally placed on urban water use than agricultural use, and projected increases in water demand for urban areas are expected to cause further shifts of water from agriculture to urban users, reducing water deliveries and increasing costs. Of all California regions, farmers in the Central Valley are the most vulnerable to water shortages.86

Because the whole agricultural sector is so dependent on irrigation, farmers across the state turn to groundwater when surface water sources are low. Historically, groundwater withdrawals have been higher during drought years, a trend seen during 2014, when access to this precious resource helped farmers weather the statewide drought with lower-than-expected losses.87 Not only does groundwater overdrafting affect aquifer integrity and cause the ground to sink,88 it also makes wells run dry, forcing farmers to drill ever deeper for water. Moreover, groundwater overdraft can lead to saltwater intrusion into the aquifer, giving the water a higher salinity level than is optimal for agricultural use. Groundwater aquifers are very slow to recover the depleted resources, and with the 2014 drought expected to continue through 2015,89 groundwater supplies will likely remain low with salinity increasing into the foreseeable future.

Weeds, Pests, and Disease

California’s agricultural industry is also extremely sensitive to the spread of invasive pests and plant species, which are expected to shift with a changing climate. New distributions of invasive species may increase the cost of weed control, which already has an $11 billion price tag per year in the U.S. alone, mostly for herbicides such as glyphosate (also known as RoundUpTM), to which some weeds have demonstrated increased tolerance at higher CO2 levels. Studies have shown that many invasive plant and insect species may actually benefit more than crops from the increased CO2 and temperatures brought about by climate change, though the relative effect of these factors on crop-weed competition is likely to be species-specific.90 In particular, milder winters increase the survival of many frost-sensitive insects such as whiteflies, which damage a variety of California crops, from strawberries to tomatoes.

Conclusion

There is little doubt that the California agricultural industry will face significant and varied risks from climate change through this century, but this sector is also one of the best equipped to manage these risks. Farmers have always adapted to changing weather and climate conditions, with adaptation and flexibility built into their business models. Armed with the right information, California farmers may be able to mitigate some of these impacts through seed modification, crop switching, and other adaptive practices.

Food systems are resilient at a regional, national, and global level, and agricultural producers have proven themselves extremely able to adapt to changing climate conditions. But these shifts can carry risks for the individual farming communities most vulnerable to projected climatic changes. As interest grows in strategies to boost climate resiliency, policy makers and agricultural business leaders will need to place a greater emphasis on helping growers put new technology and methods to use that can help maintain current productivity levels while boosting resilience to climate change in the long term.

Groundwater Nelson. Residents drill groundwater well by rice field near Nelson, California.

Residents drill groundwater well by rice field near Nelson, California.

Additional California Climate Risks

For scientists studying climate change, the connections between increased greenhouse gas emissions and rising heat are very clear. For this reason, the Risky Business Project analysis has focused primarily on the economic impact of rising heat on energy demand, labor productivity, commodity agriculture, and mortality.

But these are not the only climate risks facing California. In this section, we examine some of the less scientifically obvious, but no less severe, impacts this state may face under unmitigated climate change. These include changes in water availability and air and water quality, as well as risks to a range of infrastructure systems. Our research here is qualitative rather than quantitative but is based on a review of some of the best climate science available. In addition, we discuss original research conducted for the Risky Business Project on changing precipitation levels.

Water Availability

One of the greatest climate risks facing California is the risk of a less predictable and reliable water supply. The state’s precipitation levels vary considerably from year to year, with the majority of rain and snow falling during the cool, wet winters in the northern and inland mountainous areas. The greatest water demand, on the other hand, exists in the Central Valley and coastal population centers during the warmer, drier months. An elaborate water storage and conveyance system helps address this mismatch in the timing and location of water supply and demand, but it was designed with historical weather and climate patterns in mind. Climate change is already altering many of these patterns.

Over the coming century, climate change will affect many key aspects of the state’s water supply: the timing, form, and amount of precipitation; surface runoff and streamflow patterns; the degree of evaporation from lakes, reservoirs, soils, and plants; and the frequency and severity of extreme weather events, which can lead to floods and droughts.

An aging infrastructure, combined with the complex legal and operating frameworks that govern water management in California, will further challenge California’s water supply. Moreover, water demand in urban areas is predicted to increase with population growth, placing additional pressure on this limited resource.91 Warmer conditions will also influence the amount of water required by plants, potentially increasing the total quantity needed for agriculture and other outdoor uses, such as landscaping.

Impact of Rising Temperatures

As temperatures rise, more precipitation will fall as rain rather than snow, leading to more immediate runoff and increased flood risk in the winter and spring with less water stored in the state’s snowpack. California has already seen a 15% decrease in the amount of precipitation that fell as snow since the 1970s.92 A state analysis projects that peak snowpack could decrease by 25% to 40% from historical levels by mid-century.93 The implications for the state’s water supply are significant, since the Sierra Nevada snowpack acts as a critical natural reservoir for roughly 15 million acre-feet (or 4.9 trillion gallons) of water. In the spring and summer, snowmelt-driven runoff releases water into the state’s rivers and ultimately into the system of dams and canals that helps supply water during the drier seasons for surface reservoirs and water-dependent industries. Runoff also plays a critical role in recharging groundwater supplies.

Higher temperatures also lead to earlier snowmelt, with the runoff contributing to a shift of peak river flows to earlier in the season. Snow is already melting 5 to 30 days earlier in California today than in the past half-century.94 According to a recent federal study, average runoff levels in the Sacramento and San Joaquin Rivers basins at the Delta—which provides water for 25 million Californians—may increase by 10% during the “cool” season (December to March) by the 2070s compared to 1990 levels. Meanwhile, runoff during the “warm” season (April to July) could decrease by 20% by the 2050s, and by more than 30% by the 2070s, even under a scenario that assumes lower emissions than the “business as usual” path used in the Risky Business analysis.95 Average annual runoff for the Colorado River basin, an important water source for the Inland South and South Coast regions, will likely decrease by almost 10% by the 2070s;96 this could contribute to a gap between water supply and demand of 3.2 million acre-feet (1 trillion gallons) by 2060.97

As reservoirs fill with winter runoff, operators may need to release excess water to guard against flood risk, resulting in less water available in the critical summer months when water demand is the highest. At the same time, rising temperatures can increase evaporation of moisture from soils, lakes, and reservoirs, further decreasing surface water supplies. Businesses and communities may shift towards using more groundwater to make up for shortages, but if groundwater use exceeds the rate of natural recharge for an aquifer, these communities’ wells could run dry and require ever deeper drilling for water. Groundwater overdraft can also lead to saltwater intrusion and compromise the overall integrity of an aquifer, causing the land to sink.

Changing precipitation patterns

Predicting climate-related changes in the timing, amount, and location of precipitation is more difficult than predicting the impact of rising temperatures on the type of precipitation, timing of snow melt, and evaporation rates. We do know that as temperatures rise, the atmosphere has the potential to hold more water vapor, and that total precipitation can increase as a result, leading to more intense and frequent extreme rainfall events in California.98 Other factors including atmospheric circulation patterns, ocean conditions, and local topography can influence the timing and location of precipitation. For example, winter storms originating over the Pacific Ocean currently produce most of the state’s precipitation.99 These Pacific storm tracks could shift northward over the century, taking their precipitation with them.100

The research underlying the Risky Business Project shows that if we stay on our current emissions path, California will see changes in average seasonal precipitation totals (e.g., changes in spring rainfall); however, we don’t see a specific trend in precipitation averages across the entire year. Regional differences may intensify these seasonal precipitation changes. For example, during the spring (currently the second wettest season in California) and autumn, precipitation will likely decrease in every region by mid- to late-century, with the largest spring decreases in the southern portion of the state and the largest fall decreases in the northern and central regions. This spring decrease is part of a broader projected decrease across the U.S. Southwest, which may influence the availability of Colorado River water for use in California. Climate models may differ on the magnitude and direction of changes in winter and summer precipitation, but they agree that winter precipitation101 is more likely than not to increase in the northern part of the state. But even though most of California’s precipitation is still likely to occur during the winter, higher temperatures mean more will fall as rain than snow. Even if precipitation levels do not change dramatically, central and southern California will still see drier conditions by mid- to end of century due to the impact of rising temperatures on snowmelt and soil moisture levels.102

Our research deals in averages, which can mask an important point: no matter what the average annual precipitation pattern, California should expect to see more extreme precipitation events and longer dry spells between them.103 While it is difficult to estimate how this will translate into future flood and drought risk given how many factors influence these events (e.g., topography, soil levels, and land use), flood risk severity and frequency in parts of California may increase if we stay on our current emissions pathway.104 One study found that flooding along the western slopes of the Sierra Nevada, for instance, is projected to increase as more intense precipitation from winter storms falls as rain rather than snow.105 The costs of increased flooding could be substantial, according a state analysis, since more than 7 million Californians and roughly $580 billion in assets currently lie within what has traditionally been a 500-year floodplain, but may become a 100-year or more frequent floodplain under changing climate conditions.106 Furthermore, there is growing evidence that drought risk will increase as well.

Water Quality

It’s not just water quantity that’s threatened by unchecked climate change, but water quality as well. Climate-related impacts throughout California, including changing air and water temperatures, precipitation intensity, periodic droughts, reductions in stream-flow, and sea-level rise can have serious effects on water quality, especially when combined with land use changes such as more surface areas covered in impervious pavement. For example, rising air and water temperatures increase thermal stratification, or the formation of distinct layers of water in lakes and reservoirs as a result of differing temperatures. Higher temperatures cause the layers to mix less readily, resulting in less dissolved oxygen delivery to lower depths and higher concentrations of nutrients and pollutants.107 These effects are already evident in Lake Tahoe, where further stratification could result in oxygen depletion, algal blooms, and fundamental changes to its food web.108 Stream and estuary temperatures are rising as well due to warmer air and lower flows, to the detriment of valuable cold-water fish like salmon.

More intense precipitation can also affect water quality by washing nutrients, sediment, and contaminants into lakes, reservoirs, and other water bodies, which is especially harmful when combined with increased wildfire activity due to climate change. Polluted waters can result in health problems: for example, one study estimated that up to 1.5 million people contract gastroenteritis from swimming at contaminated beaches in Southern California each year.109 Conversely, low water flows can increase sedimentation, pollutant concentrations, and salinity, presenting a challenge to wastewater treatment facilities.110 Coastal aquifers may also be subject to saltwater intrusion from sea-level rise and efforts to meet water demand through groundwater withdrawal at rates exceeding an aquifer’s natural recharge rate. Sea-level rise can threaten tidal marshes and wetland areas as well, which are important plant and animal habitats that also deliver critical ecosystem services including water purification and flood protection.111

Infrastructure

California’s critical energy and transportation infrastructure faces significant climate related risks over the course of the century, including more frequent and intense wildfires, prolonged drought, and accelerated sea-level rise.

Energy systems

The models underlying the Risky Business Project consider the effect of increasing temperatures on electricity generation, transmission, and distribution infrastructure, but do not specifically address the potential effects of drought and wildfire on these systems.

These effects can be significant. For example, California’s hydropower systems are highly dependent on precipitation trends, including the amount and timing of snowpack runoff. The state currently benefits from affordable hydroelectric generation capacity, which accounts for 12% of total electricity generation.112 However, summer hydropower potential from several California rivers is projected to decrease by 25% as a result of earlier snowmelt, and statewide capacity has been projected to decrease by 20% by the period 2070- 2099.113 Recent droughts offer examples of the type and extent of potential impacts to our hydropower systems: under drought conditions in the summer of 2012, low precipitation levels and reduced Sierra Nevada snowpack resulted in a decrease in statewide hydroelectric generation of 38% compared to the previous year.114

Given hydropower’s relatively low cost, decreased generation from this sector can result in added expenses for consumers as utilities shift to more expensive options; this effect was apparent between 2007 and 2009, when drought conditions forced utilities to turn to natural gas-powered electricity generation, at a cost to ratepayers of $2 billion.115

Wildfire can also affect energy systems. In October 2007, fire damage to several dozen transmission lines in the southern part of the state left 80,000 San Diego residents without power for prolonged periods.116 In August 2013, Governor Jerry Brown declared a state of emergency for the City of San Francisco due to the Yosemite Rim Fire, which threatened Bay Area water and power resources at the Hetch Hetchy Reservoir.117 A state analysis estimated that as a result of warmer, drier conditions, potential wildfire exposure for some power transmission lines could increase by 40% by the end of the century.118

Sea-Level Rise, Storm Surge and Coastal Flooding

Sea-level rise will bring a host of challenges for state and local governments and coastal property owners. California’s population and wealth are concentrated largely in coastal counties, which will see varying levels of sea-level rise and related risks. However, nearly half of the state’s coast (including 1,100 miles of Pacific coastline and 500 miles of shoreline in the San Francisco Bay) has been identified as having high or extremely119 high vulnerability to sea-level rise.

Our research estimates the value of property that could be inundated along the California coast at various mean sea-levels, but does not provide additional details on the particular type and specific location of the property at risk. A previous analysis prepared for the State of California estimated that mean sea-level rise of 4.6 feet along the California coast by the end of this century—roughly matching our own 1-in-20 probability projections of more than 4 feet of sea-level rise by 2100—would put the following specific facilities at risk of inundation:120

  • 140 schools
  • 55 healthcare facilities
  • 3,500 miles of roads and highways
  • 280 miles of railways
  • 330 EPA hazardous waste facilities or sites
  • 28 waste water treatment sites
  • 30 power plants with a capacity of 10,000 MW
  • Oakland and San Francisco international airports

A subsequent study using the same estimate of sea-level rise found that $62 billion worth of property and infrastructure would be put at risk in the San Francisco Bay Area alone.121 This study found that with just 1.6 feet of sea-level rise—well below the Risky Business Project projections for late century—160,000 residents and workers across the San Francisco Bay Area would be put at risk of inundation in a 100-year flood event.

California’s ports, which handle 45% to 50% of all containers shipped into the U.S., could face damage and disruptions associated with coastal erosion due to rising sea-levels, storm surge, and coastal flooding; the Port of Los Angeles has already completed at least one vulnerability assessment, and the Ports of Long Beach and Oakland are currently developing their own adaptation plans.122

Coastal erosion is already a significant risk to property and transportation infrastructure such as roads, highways, and bridges, and may accelerate as a result of rising sea-levels. Coastal erosion and storms also affect the state’s beaches; mean sea-level rise of 4.6 feet by end of century would result in the loss of 41 square miles of beach. Approximately 14,000 California residents live in areas at high risk of future erosion.123

Sea-level rise effects are not restricted to coastal areas. Critical inland water supply and delivery infrastructure could also be damaged or overwhelmed by rising tides. Rising sea-levels could cause increasing levy failures along inland waterways such as the Sacramento-San Joaquin River Delta, endangering the City of Sacramento and surrounding areas, which sit in floodplains at the confluence of the Sacramento and American Rivers.124

Air Quality

Yosemite Rim Fire. Satellite view of the 2014 Yosemite Rim Fire

Satellite view of the 2014 Yosemite Rim Fire

Climate change is likely to add to the already significant air quality challenges in California. Over the past few decades, the state has made significant strides in reducing air pollution, yet California remains home to six of the top 10 most polluted cities in the nation for ozone and fine particulate matter (known as PM2.5, which describes particulate matter of 2.5 micrometers in diameter or less, or roughly one-thirtieth the width of a human hair).125 More than 90% of the state’s population lives in areas that violate federal health-based standards for ozone and PM2.5.126 Exposure to unhealthy levels can aggravate lung and heart diseases, leading to premature deaths, increased hospitalizations and emergency room visits, and absences from work or school. Ozone and particulate matter pollution contribute to 8,800 premature deaths and more than $70 billion in health-related costs in California each year; the most severe ozone levels are found in the San Joaquin Valley and parts of the South Coast region.127

Higher temperatures will affect some of the conditions conducive to ozone and PM2.5 formation in several ways. For example, the atmospheric reactions that form ozone speed up as temperatures rise. A recent state analysis found that temperature increases consistent with a mid-range warming scenario would increase the number of days with weather favorable to ozone formation by 75% to 85% in Los Angeles and the San Joaquin Valley.128 The five million Californians currently diagnosed with asthma and individuals who exercise or work outdoors are among the most vulnerable to the impacts of ozone.129

Wildfires are another significant source of particulate pollution, and are likely to increase in frequency and intensity amidst warm and dry conditions associated with climate change. One study noted a 34% surge in hospitalizations for asthma during the Southern California wildfires in 2003 as PM2.5 levels in surrounding areas increased to unsafe levels.130 Another study estimated the total cost for pneumonia and asthma hospitalizations from these fires alone to be roughly $10 million.131

Humans are not the only species affected by increased air pollution. Ozone uptake by plants inhibits photosynthesis and growth, influencing crop yields and quality. Studies have shown that current ambient levels of ozone are already decreasing crop yields for alfalfa, bean, cotton, peanut, rice, soybean, and wheat in many regions of the U.S. One study of soybeans in the Midwest found that elevated ozone levels are responsible for yield losses of up to 10%, causing approximately $1 billion in losses for the Iowa-Indiana-Illinois region.133 Elevated CO2 and ozone interact to affect yields: in certain cases, elevated CO2 lessens ozone damage, but ozone may also offset the benefits of carbon fertilization described in the section beginning on page 35.134

Giant Redwoods. California’s Giant Redwoods in fog.

California’s Giant Redwoods in fog.

Conclusion: Mitigating Risk

The California economy faces multiple and significant risks from climate change if the world stays on its current emissions path. Given the range and extent of these climate risks, it is clear that staying on this pathway will only increase the state’s exposure.

Figure 8. Our research examines the risks of the U.S. continuing on its current path, or “business as usual.” Alternate pathways that include investments in policy and other efforts to mitigate climate change through lowering carbon emissions could significantly reduce these risks. Original data source, adapted: Meinshausen and others 2011.

Our research examines the risks of the U.S. continuing on its current path, or “business as usual.” Alternate pathways that include investments in policy and other efforts to mitigate climate change through lowering carbon emissions could significantly reduce these risks. Original data source, adapted: Meinshausen and others 2011.

Global Emissions Scenarios

The Risky Business Project research shows that if we act now to move onto a different path, we can still avoid many of the worst impacts of climate change, particularly those related to extreme heat. We are fully capable of managing climate risk, just as we manage risk in many other areas of our economy and national security—but only if we start to change our business and public policy decisions today.

Every year that goes by without a comprehensive public and private sector response to climate change is a year that locks in future climate events that will have a far more devastating effect on our local, regional, and national economies. Moreover, both government and the private sector are making investment decisions today—whether in property, infrastructure, or regional and national supply chains—that will be directly affected by climate change in decades to come. On the other hand, if both the government and private sector act now to reduce emissions, the U.S. can significantly reduce the odds of costly climate outcomes.

The good news is that California is already taking aggressive action to reduce its greenhouse gas emissions and prepare for a warmer climate. But state action alone will not be sufficient to avoid the worst impacts of climate change. California business and policy leaders can play a critical role in modeling strong climate resilience and emissions reductions, and in pushing the U.S. into a global leadership position on climate change.

The Risky Business Project does not dictate a preferred set of solutions to climate change; while we fully believe the U.S. can respond to these risks through climate preparedness and mitigation, we do not argue for a specific set or combination of these policies. Rather, we document the risks and leave it to decision-makers in the business and policy communities to determine their own tolerance for, and specific reactions to, those risks.

We know there will be a diversity of responses to our analysis depending on the particular risk tolerance of individual business and policy actors, as well as their particular region or sector of the economy. But the Risk Committee does believe, based on this project’s independent research and the significance of the climate risks it demonstrates, that it is time for all business leaders and investors in California to get in the game and rise to the challenge of addressing climate change. The fact is that, just as the investments and economic choices we made over the past several decades have increased our current vulnerability to climate change, so will the choices we make today determine what the state and nation looks like over the next 25 years, at mid-century, and by 2100.

In short, we have a choice whether we accept the climate risks laid out above or whether we get on another path. This is not a problem for another day. The investments we make today—this week, this month, this year—will determine our economic future.

There are three general areas of action that can help to minimize the risks California businesses currently face from climate change:

Changing everyday business practices to become more resilient.

Some of the climate impacts we analyzed are already being felt across the nation; indeed, some are already an unalterable part of our economic future. Rational business actors must adapt. In California, the agricultural sector is on the front lines of climate adaptation. As Risk Committee member Greg Page has noted, “Farmers are innovators and consummate optimizers…. They persistently demonstrate the ability to adapt to changes in the environment and successfully adopt new technologies.” But this adaptation may come at a price: Some farmers in the most-affected southern California regions, for instance, may suffer economic losses shifting to new crops (with required new equipment and expertise, as well as long maturation periods for perennial crops), if they can afford to shift at all. Meanwhile, cities across the state are being forced to adapt to climate realities, such as rising sea-levels, energy costs, and mortality rates, without adequate financial support from the federal government.

Incorporating risk assessment into capital expenditures and balance sheets.

Another area where today’s business investments have a direct relationship to tomorrow’s climate impacts is in long-term capital expenditures, which will live well into the middle of the century and beyond. Today, ratings agencies are evaluating infrastructure projects with a multi-decade lifespan. Utilities are making investments in new power plants and pipelines, and signing long- term power purchase agreements that rely on those investments. And real estate investors are making multiple bets on residential and commercial properties.

These investments must be evaluated in terms of the actual climate risk that specific regions face as we approach the middle of this century. In 2010, recognizing this reality, the Securities and Exchange Commission (SEC) issued Interpretive Guidance on climate disclosure, giving companies some idea of how to consider their “material” risks from climate change; unfortunately, as of 2013, over 40% of companies listed on the Standard & Poor’s 500 Index were still not voluntarily disclosing climate risks.

Instituting policies to mitigate and adapt to climate change.

Ultimately, climate change is not just an issue for specific sectors and regions: It is a global issue that demands an effective policy response from the U.S. According to the latest Intergovernmental Panel on Climate Change report, the world may have as little as 15 years to “keep planetary warming to a tolerable level,” through an aggressive push to bring down carbon emissions.

In the Risky Business Project, we focused primarily on modeling our current economic path and the attendant climate risks. Because this is the path we’re now following as a nation, we need to better understand the potential risks it poses and decide how to respond to those risks—especially those that are already embedded in our economy because of decisions we made decades ago.

But the path we’re on today does not have to be the path we choose to follow tomorrow. Our analysis also looks at alternate pathways that include investments in policy and other efforts to mitigate climate change through lowering greenhouse gas emissions. These alternate pathways could significantly change the climate impacts we discuss above. For example, modest global emission reductions can avoid up to 80% of projected economic costs resulting from increased heat-related mortality and energy demand.

Our goal in this report is not to dictate those policy pathways. However, we do strongly urge the California business community to play an active role in supporting state policymakers and elected officials as they take steps toward climate mitigation and preparedness, so that California can continue to model the kind of behavior we need to see nationally on these issues. California is already taking steps in this direction, with regions across the state investing in renewable energy, industrial efficiency, and alternative vehicles and fuels. These activities are critical in showing the state’s public and private sector leadership in addressing short-term climate actions and long-term climate risk. Ultimately, the single most effective way for businesses to decrease the risks we have identified in this project is for business leaders to push for strong and consistent public sector action to address those risks.

With this project, we have attempted to provide a common language for how to think about climate risk—built upon a common language of risk that is already part of every serious business and investment decision we make today. If we have a common, serious, non-partisan language describing the risks our nation may face from climate change, we can use it as the springboard for a serious, non-partisan discussion of the potential actions we can take to reduce our regional, national, and ultimately global climate risks.

Golden Gate. Golden Gate Bridge, San Francisco

Golden Gate Bridge, San Francisco

View footnotes

  1. The “current greenhouse gas emissions pathway” we use throughout the report refers to RCP 8.5, one of the four “Representative Concentration Pathways” developed by the Integrated Assessment Modeling Consortium. It represents a continuation of recent global emissions growth rates, with atmospheric concentrations of CO2 reaching 940 ppm by 2100.
  2. We considered the state’s major economic and population centers and key climate zones to divide the state into regions that were of sufficient size to ensure quality modeling results.
  3. NOAA, “NOAA’s State of the Coast,” May 1, 2013 (last accessed February 2015).
  4. U.S. Census, “States With Coastal Counties—Population, Housing Units, Establishments, and Employees by Coastal Region and State: 2000 to 2010,” (last accessed February 2015).
  5. R. Kopp and others, “Probabilistic 21st and 22nd century sea-level project ions at a global network of tide gauge sites,” Earth’s Future 2 (2014): 287–306.
  6. International Trade Administration, “California Exports, Jobs, and Foreign Investment,” available at http://www.trade.gov/mas/ian/statereports/states/ca.pdf (last accessed February 2015).
  7. The Inland South region includes: San Bernardino, Inyo, Riverside, and Imperial counties.
  8. Rhodium Group estimates (population source described above). GDP by state: Bureau of Economic Analysis, from State GDP for all industries and regions, 2008-2013, available at http://www.bea.gov/iTable/iTable.cfm?reqid=70&-step=1&isuri=1&acrdn=1. Accessed 08/07/2014. GDP by urban area is equal to BEA state GDP distributed by county using IMPLAN county-level value added (IMPLAN Group: 2012 Implan National Data Package).
  9. All agricultural output values for the regions were calculated by aggregating county data from: USDA, National Agricultural Statistics Service, “2012 Census of Agriculture – County Data” (2012).
  10. All total annual death figures in the report were calculated using state- or region-specific heat-related mortality rates multiplied by that region’s 2012 population.
  11. U.S. Bureau of Labor Statistics, “The Recession of 2007- 2009” (February 2012), available at http://www.bls.gov/spotlight/2012/recession/pdf/recession_bls_spotlight.pdf.
  12. The South Coast region includes: San Diego, Orange, Los Angeles, Ventura, Santa Barbara, and San Luis Obispo counties.
  13. D. Walters, “California Still has Nation’s Largest Manufacturing Sector,” The Sacramento Bee, January 27, 2015, available at http://www.sacbee.com/news/politics-government/capitol-alert/article8334159.html.
  14. United States Department of Transportation, “Table 1-57: Tonnage of Top 50 U.S. Water Ports, Ranked by Total Tons (a),” available at http://www.rita.dot.gov/bts/sites/rita.dot.gov.bts/files/publications/national_transportation_statistics/html/table_01_57.html (last accessed February 2015).
  15. California Chamber of Commerce, “Ports More Competitive Can Help Regional, State Economies,” (2014).
  16. J. Melillo, T. Richmond, and G. Yohe, “Climate Change Impacts in the United States: The Third National Climate Assessment” (U.S. Global Change Research Program: 2014), available at http://www.globalchange.gov/ncadac.
  17. The San Joaquin Valley region includes: San Joaquin, Stanislaus, Merced, Madera, Fresno, Kings, Tulare, and Kern counties. Some of the counties in this region may be considered by residents and other analyses as part of another region, such as the Sierra, or Sacramento Valley. For the sake of the analysis we did not divide up the counties.
  18. A. Avalos and D. Vera, “The Petroleum Industry and the Monterey Shale: Current Economic Impact and the Economic Future of the San Joaquin Valley” (Fresno: California State University, 2013), available at http://www.wspa.org/sites/default/files/uploads/The%20Petroleum%20Industry%20and%20the%20Monterey%20 Shale%20-%20Fresno%20State%20Study.pdf.
  19. K. Thuot, “Half of US Oil Production Comes from these 20 Counties,” available at http://info.drillinginfo.com/half-us-oil-production-comes-20-counties/ (last accessed February 2015).
  20. University of California Cooperative Extension, “Kern County,” available at http://cekern.ucanr.edu/ (last accessed February 2015).
  21. California Energy Commission,” Alta Wind Energy Center,” available at http://www.energy.ca.gov/tour/alta/.
  22. Sunpower, “The Solar Star Projects”, available at http://us.sunpower.com/utility-scale-solar-power-plants/solar-energy-projects/solar-star-projects/.
  23. J. Chong, “California’s 2006 Heat Wave was much Deadlier than Previously Reported, Researchers Say,” Los Angeles Times, July 21st 2009, available at http://articles.latimes.com/2009/jul/21/local/me-heat-deaths21; see also S. Hoshiko and others, “A simple method for estimating excess mortality due to heat waves, as applied to the 2006 California heat wave” International Journal of Public Health 55(2) (2010): 133-137, available at: http://www.ncbi.nlm.nih.gov/pubmed/19680599.
  24. USGS, “The California Drought,” (February 2015) available at: http://ca.water.usgs.gov/data/drought/ (last accessed March 2015).
  25. R. Howitt and others, “Economic Analysis of the 2014 Drought for California Agriculture” (Davis: Center for Watershed Sciences, University of California, Davis 2014), available at https://watershed.ucdavis.edu/files/content/news/Economic_Impact_of_the_2014_California_Water_Drought.pdf.
  26. K. Trenberth and others, “Global warming and changes in drought”, Nature Climate Change, 4, 17-22, available at http://www.nature.com/nclimate/journal/v4/n1/full/nclimate2067.html; see also R. Seager and M. Hoerling, “Atmosphere and Ocean Origins of North American Droughts,” Journal of Climate, 27 (2014): 4581–4606, available at http://journals.ametsoc.org/doi/abs/10.1175/JCLI-D-13-00329.1.
  27. N. Diffenbaugh, D. Swain, and D. Touma, ”Anthropogenic warming has increased drought risk in California,” PNAS (2015); see also S. Rauscher and others, “Future changes in snowmelt-driven runoff timing over the western US,” Geophysical Research Letters 35 (16) (2008):L16703, available at http://onlinelibrary.wiley.com/doi/10.1029/2008GL034424/abstract; see also M. Ashfaq and others, “Near-term acceleration of hydroclimatic change in the western U.S.” Journal of Geophysical Research: Atmospheres 118(10) (2013):10,676–10,693, available at http://onlinelibrary.wiley.com/doi/10.1002/jgrd.50816/abstract.
  28. Diffenbaugh and others, “Anthropogenic warming has increased drought risk in California.”
  29. Diffenbaugh and others, “Anthropogenic warming has increased drought risk in California.”
  30. B.Cook and others,. “Unprecedented 21st century drought risk in the American Southwest and Central Plains,” (2015) Science Advances, available at: http://advances.sciencemag.org/content/1/1/e1400082.
  31. H. Wang and S. Schubert, “Causes of the extreme dry conditions over California during early 2013,” Bulletin of American Meteorological Society 95 (2014): S7–S11, available at http://www2.ametsoc.org/ams/assets/File/publications/BAMS_EEE_2013_Full_Report.pdf ; see also D. Swain et al., “The extraordinary California drought of 2013-2014: character, context, and the role of climate change” in “Explaining Extremes of 2013 from a Climate Perspective” Bulletin of the American Meteorological Society 95 (2014) : S3–S7.
  32. Swain and others, “The extraordinary California drought of 2013-2014” ; S.Wang and others, “Probable causes of the abnormal ridge accompanying the 2013–2014 California drought: ENSO precursor and anthropogenic warming footprint,” Geophysical Research Letters 41(9) (2014):3220–3226, available at http://onlinelibrary.wiley.com/doi/10.1002/2014GL059748/abstract; S. Wang, W. Huang, and J. Yoon, “The North American winter ‘dipole’ and extremes activity: a CMIP5 assessment,” Atmospheric Science Letters (2015), available at http://onlinelibrary.wiley.com/doi/10.1002/asl2.565/abstract.
  33. The Sacramento Valley region includes: Trinity, Shasta, Tehama, Glenn, Butte, Colusa, Sutter, Yuba, Yolo, Placer, El Dorado, Sacramento. El Dorado and Placer are large counties that encompass valley, foothill, and mountainous terrain, including Lake Tahoe and portions of the Sierra Nevada. For the sake of this analysis, we did not divide counties.
  34. California Department of Food and Agriculture (CDFA), “California Agricultural Statistics Review 2013-2014,” (2014), available at http://www.cdfa.ca.gov/Statistics/.
  35. J. Melillo et al, “Climate Change Impacts in the United States: The Third National Climate Assessment”; California Climate Change Center, “Economic Impacts of Delta Levy Failure due to Climate Change: A Scenario Analysis, “ (2006) CEC-500-2006-004-SD, available at: http://ccrm.berkeley.edu/pdfs_papers/delta_levee_failure.pdf.
  36. Department of Water Resources, “Pumping Continues at Jones Tract” (2004), available at: http://www.water.ca.gov/news/newsreleases/2004/071604flood.pdf.
  37. Bay Delta Conservation Plan, “Appendix 1A: Primer on the Delta and California Water Delivery Systems,” (November 2013).
  38. National Research Council, “Sustainable Water and Environmental Management in the California Bay- Delta” (2012), available at http://dels.nas.edu/Report/Sustainable-Water-Environment/13394.
  39. The Bay Area & Central Coast region includes: Sonoma, Napa, Marin, Solano Contra Costa, Alameda, Santa Clara, San Mateo, San Francisco, Santa Cruz, San Benito, Monterey counties.
  40. California Chamber of Commerce, “Making California Ports More Competitive Can Help Regional, State Economies,” (2014), available at http://www.calchamber.com/governmentrelations/issuereports/documents/2014-reports/california-ports-2014.pdf.
  41. San Francisco Bay Conservation and Development Commission, “Living With a Rising Bay: Vulnerability and Adaptation in San Francisco Bay and on its Shoreline” (2011), available at http://www.bcdc.ca.gov/BPA/LivingWithRisingBay.pdf.
  42. Sea-level Rise Committee of SF Adapt, “Guidance for Incorporating Sea-level Rise into Capital Planning in San Francisco: Assessing Vulnerability, Risk, and Adaptation (Draft)” (2014), available at: http://www.acfloodcontrol.org/SFBayCHARG/pdf/sf_slr_guidance.pdf.
  43. The Sierra region includes: Modoc, Lassen, Plumas, Sierra, Nevada, Alpine, Amador, Calaveras, Tuolumne, Mariposa and Mono counties.
  44. E. Burakowski and M. Magnusson, “Climate Impacts on the Winter Tourism Economy in the United States”(New York: Natural Resources Defense Council; California: Protect Our Winters, 2012), available at http://protectourwinters.org/climate_report/report.pdf.
  45. Branch, “As Snow Fades, California Resorts are Left very High and Dry,” The New York Times, November 23, 2014, available at http://www.nytimes.com/2014/11/24/sports/skiing/as-snow-fades-california-ski-resorts-face-a-brown-future.html.
  46. Burakowski and Magnusson, “Climate Impacts on the Winter Tourism Economy in the United States”
  47. Burakowski and Magnusson, “Climate Impacts on the Winter Tourism Economy in the United States”
  48. California Department of Water Resources, “Scant Precipitation, Warm Temperatures Produce Weak Snowpack,” available at http://www.water.ca.gov/news/newsreleases/2015/012915snowpack.pdf (last accessed February 2015).
  49. Branch, “As Snow Fades, California Resorts are Left very High and Dry”
  50. The North Coast region includes: Del Norte,Siskiyou, Humboldt, Mendocino, and Lake counties.
  51. CDFA, “California Agricultural Statistics Review 2013-2014”
  52. Caltrans, “Freight Planning Fact Sheet: Port of Humboldt Bay,” available at http://dot.ca.gov/hq/tpp/offices/ogm/ships/Fact_Sheets/Port_of_Humboldt_Bay_Fact_Sheet_073012.pdf (last accessed February 2015).
  53. National Oceanic and Atmospheric Administration, “Average Annual Northern California Precipitation,” available at http://www.wrh.noaa.gov/sto/norcalpcpn.php (last accessed March 2015).
  54. Cambridge Systematics, “Addressing Climate Change Adaptation in Regional Transportation Plans: A Guide for California MPOs and RTPAs” (2013), available at http://www.camsys.com/pubs/FR3_CA_Climate_Change_Adaptation_Guide_2013-02-26_.pdf; see also “California Flood Risk: Sea-level Rise Arcata South Quadrangle,”; see also “California Flood Risk: Sea-level Rise Eureka Quadrangle,”; see also “California Flood Risk: Sea-level Rise Crescent City Quadrangle.”
  55. Center for Economic Development at California State University, Chico, “Del Norte County Economic and Demographic Profile” (2014), available at http://www.dnltc.org/wp-content/uploads/2014/12/DelNorteCountyProfile2014.pdf.
  56. G. Garfin and others, “Assessment of Climate Change in the Southwest United States: A Report Prepared for the National Climate Assessment,” (Washington, DC: Southwest Climate Alliance, 2013), available at: http://swccar.org/sites/all/themes/files/SW-NCA-color-FINALweb.pdf.
  57. G. Garfin and others, “Assessment of Climate Change in the Southwest United States: A Report Prepared for the National Climate Assessment,” (Washington, DC: Southwest Climate Alliance, 2013), available at: http://swccar.org/sites/all/themes/files/SW-NCA-color-FINALweb.pdf.
  58. A. Westerling and others, “Climate Change, Growth and California Wildfire,” (California Climate Change Center, 2009). Westerling et al rely on the IPCC’s SRES A2 emissions scenario. Additional information on this scenario can be found here: US GCRP, “Emissions, Concentrations, and Temperature Projections” http://www.globalchange.gov/browse/multimedia/emissions-concentrations-and-temperature-projections.
  59. USDA, “Bark Beetles in California Conifers, are your Trees Vulnerable?” (2006), available at http://learnmoreaboutclimate.colorado.edu/uploads/model-lessons/mountain-pine-beetles/bark-beetles-brochure.pdf.
  60. Cal Fire, “20 Largest California Wildfires,” available at http://www.fire.ca.gov/communications/downloads/fact_sheets/20lacres.pdf (last accessed February 2015).
  61. Garfin and others, “Assessment of Climate Change in the Southwest United States: A Report Prepared for the National Climate Assessment.”; see also R. Cleetus and K. Mulik, “Playing with Fire: How Climate Change and Development Patterns Are Contributing to the Soaring Costs of Western Wildfires” (Massachusetts: Union of Concerned Scientists, 2014), available at http://www.ucsusa.org/sites/default/files/legacy/assets/documents/global_warming/playing-with-fire-report.pdf.
  62. CDFA “California Agricultural Statistics Review 2013-2014”
  63. CDFA “California Agricultural Statistics Review 2013-2014”
  64. USDA National Agricultural Statistics Service, “2013 State Agriculture Overview” available at http://www.nass.usda.gov/Quick_Stats/Ag_Overview/stateOverview.php?state=CALIFORNIA (last accessed February 2015).
  65. California Department of Food and Agriculture, “Climate Change Consortium for Specialty Crops: Impacts and Strategies for Resilience” (2013), available at http://www.cdfa.ca.gov/environmentalstewardship/pdfs/ccc-report.pdf.
  66. Calcot, “California Cotton Questions & Answers,” available at http://www.calcot.com/ourcotton.asp?post=cavar (last accessed February 2015)
  67. D. Lobell and others, “Impacts of Future Climate Change on California Perennial Crop Yields: Model Projections with Climate and Crop Uncertainties” Agricultural and Forest Meteorology 141 (2-4) (2006): 208-218, available at http://www.sciencedirect.com/science/article/pii/S016819230600308X.
  68. D. Baldocchi and S. Wong, “Accumulated winter chill is decreasing in the fruit growing regions of California,” Climatic Change 87 (2008): S153-S166, available at http://cnap.ucsd.edu/pdffiles/Baldocchi_fruit_jan2008.pdf.
  69. D. Baldocchi and E. Waller, “Winter fog is decreasing in the fruit growing region of the Central Valley of California,” Geophysical Research Letters 41 (9) (2014): 3251-3256, available at http://onlinelibrary.wiley.com/doi/10.1002/2014GL060018/abstract.
  70. D. Lobell and C. Field, “California Perennial Crops in a Changing Climate” Climatic Change 109(1) (2011): 317-333, available at http://link.springer.com/article/10.1007%2Fs10584-011-0303-6.
  71. This study used climate projections from two emissions scenarios (SRES A2 and B1), both of which have lower greenhouse gas emissions than RCP 8.5.
  72. Lobell and Field “California Perennial Crops in a Changing Climate”
  73. J. Rankin, “Alarm as Almond Farms Consume Water” The Guardian, September 13, 2014, available at http://www.theguardian.com/business/2014/sep/14/alarm-almond-farmers-drain-california-dry.
  74. T. Philpott, “Charts That Show How We Became China’s Grocery Store and Wine Cellar,” Mother Jones, May 5, 2014, available at http://www.motherjones.com/tom-philpott/2014/05/china-us-food-pork-wine-export-import.
  75. R. M. de Orduña, “Climate change associated effects on grape and wine quality and production,” Wine Economics and Policy 3 (2) (2014): 81-89, available at http://www.sciencedirect.com/science/article/pii/S2212977414000222.
  76. D. Lobell and others, “Impacts of Future Climate Change on California Perennial Crop Yields.”
  77. J. Bunce, “Carbon dioxide effects on stomatal responses to the environment and water use by crops under field conditions,” Oecologia 140 1-10 (2004), available at http://www.usmarc.usda.gov/SP2UserFiles/ad_hoc/12755100FullTextPublicationspdf/Publications/bunce/carbondioxidestomatal.pdf.
  78. S. Long and others, “Food for Thought: Lower Than Expected Crop Yield Simulations with Rising CO2 Concentrations,” Science 312 (2006): 1918-1921, available at http://www.uniroma2.it/didattica/Fotosintesiamb/deposito/FACE.pdf.
  79. CDFA, “California Agricultural Statistics Review 2013-2014”
  80. California Employment Development Department, “California Agricultural Bulletin,” (2014), available at http://www.calmis.ca.gov/file/agric/2014-1cab.pdf.
  81. T. Wheeler and C. Reynolds, “Predicting the risks from climate change to forage and crop production for animal feed,” (Reading: American Society of Animal Science 2013), available at https://www.animalsciencepublications.org/publications/af/pdfs/3/1/36.
  82. E. Hanak and J. Mount, “California’s Future: Water,” (Public Policy Institute of California, 2015), available at http://www.ppic.org/content/pubs/report/R_215EH2R.pdf.
  83. J. Hatfield and others, “Chapter 2: Agriculture,” in “The Effects of Climate Change on Agriculture, Land Resources, Water Resources, and Biodiversity,” (Washington: U.S. Climate Change Science Program, 2008), available at http://www.usda.gov/oce/climate_change/SAP4_3/CCSPFinalReport.pdf.
  84. W. Schlenker, W. Hanemann, and A. Fisher, “Water Availability, Degree Days, and the Potential Impact of Climate Change on Irrigated Infrastructure in California,” (2005), available at http://are.berkeley.edu/~fisher007/ClimateChange.pdf.
  85. USDA “California Drought 2014: Crop Sectors,” available at http://ers.usda.gov/topics/in-the-news/california-drought-2014-farm-and-food-impacts/california-drought-2014-crop-sectors.aspx (last accessed February 2015)
  86. S. Tanaka and others, “Climate Warming and Water Management Adaptation for California,” Climatic Change (2006).
  87. Howitt and others, “Economic Analysis of the 2014 Drought for California Agriculture”
  88. M. Sneed, J.Brandt, and M. Solt, “Subsidence along the Delta-Mendota Canal in the Northern Part of the San Joaquin Vally, California, 2003-10,” U.S. Geological Survey Scientific Investigations Report 2013, available at http://pubs.usgs.gov/sir/2013/5142/.
  89. Howitt and others “Economic Analysis of the 2014 Drought for California Agriculture”
  90.  L. Ziska, “Global Climate Change and Carbon Dioxide: Assessing Weed Biology and Management,” in C. and D. Rosenzweig & Hillel (Eds.), “Handbook of climate change and agroecosystems: Impacts, adaptation and mitigation,” (Hackensack, NJ: World Scientific Publishing, 2010), pp.191-208.
  91. M. Rayej, “California Future Water Demand Projections (WEAP Model): Implications for Energy Demand,” (2012) Water-Energy Conference, Peking University, available at: http://www.weap21.org/Downloads/Water_Energy_WEAP_China.pdf.
  92. Branch, “As Snow Fades, California Resorts are Left very High and Dry”
  93. Department of Water Resources, “Managing an Uncertain Future: Climate Change Adaptation Strategies for California’s Water” (The Resources Agency, 2008), available at: http://www.water.ca.gov/climatechange/docs/ClimateChangeWhitePaper.pdf.
  94. J. Ekstrom and S. Moser, “Climate Change Impacts, Vulnerabilities, and Adaptation in the San Francisco Bay Area: A Synthesis of PIER Program Reports and Other Relevant Research,” (California Energy Commission, 2012), available at http://www.energy.ca.gov/2012publications/CEC-500-2012-071/CEC-500-2012-071.pdf.
  95. This study uses the SRES A2 scenario, which has a lower greenhouse gas trajectory than RCP 8.5. Additional information on this scenario can be found here: US GCRP, “Emissions, Concentrations, and Temperature Projections” http://www.globalchange.gov/browse/multimedia/emissions-concentrations-and-temperature-projections.
  96. Bureau of Reclamation, “Reclamation Managing Water in the West. SECURE Water Act Section 9503(c) – Reclamation Climate Change and Water” (U.S. Department of the Interior, 2011), available at: http://www.usbr.gov/climate/SECURE/docs/SECUREWaterReport.pdf.
  97. Bureau of Reclamation, “Reclamation Managing Water in the West. Factsheet on Colorado River Basin Water Supply and Demand Study,” (U.S. Department of the Interior, 2013) available at: http://www.usbr.gov/lc/region/programs/crbstudy/FactSheet_June2013.pdf.
  98. California Natural Resources Agency, “Safeguarding California: Reducing Climate Risk” (2014), available at http://resources.ca.gov/docs/climate/Final_Safeguarding_CA_Plan_July_31_2014.pdf.
  99. Garfin and others, “Assessment of Climate Change in the Southwest United States: A Report Prepared for the National Climate Assessment”
  100. E. Salathe, Jr., “Influences of a shift in North Pacific storm tracks on western North American precipitation under global warming,” Geophysical Research Letters 33 (2006), available at: http://www.atmos.washington.edu/~salathe/papers/published/Salathe_stormtracks_GRL2006.pdf.
  101. D. Pierce and others, “Probabilistic estimates of future changes in California temperature and precipitation using statistical and dynamical downscaling,“ Climate Dynamics (2012), available at: http://tenaya.ucsd.edu/~cayan/New_Pubs/D30_Pierce_etal_2012_CD.pdf; Michael Karparsky and Peter Gleick, “Climate Change and Water Resources: A Survey and Summary of the Literature,” (Oakland: Pacific Institute, 2003), available at: http://www2.pacinst.org/reports/climate_change_and_california_water_resources.pdf.
  102. California Natural Resources Agency, “Safeguarding California: Reducing Climate Risk”; see also California Energy Commission, “Our Changing Climate 2012: Vulnerability and Adaptation to the Increasing Risks from Climate Change in California” (2012)
  103. D. Pierce and others, “Probabilistic estimates of future changes in California temperature and precipitation using statistical and dynamical downscaling.“; see also National Climate Assessment, “Our Changing Climate” (2013); see also Daniel R. Cayan and others, “Scenarios of Climate Change in California: An Overview” (California Climate Change Center, 2006), available at: http://www.energy.ca.gov/2005publications/CEC-500-2005-186/CEC-500-2005-186-SF.PDF.
  104. M. Dettinger, “Climate Change, Atmospheric Rivers, and Floods in California – A Multimodel Analysis of Storm Frequency and Magnitude Changes” Journal of the American Water Resources Association 47(3) (2011): 514-523, available at: http://tenaya.ucsd.edu/~dettinge/md_jawra2011.pdf.
  105. Garfin and others, “Assessment of Climate Change in the Southwest United States: A Report Prepared for the National Climate Assessment”
  106. Department of Water Resources, “California’s Flood Future: Recommendations for Managing the State’s Flood Risk” (California Natural Resources Agency, 2013), available at: http://www.water.ca.gov/SFMP/resources/ca_flood_future_highlight.pdf.
  107. A. Georgakakos and others, “Chapter 3: Water Resources. Climate Change Impacts in the United States” in J. M. Melillo, T.C. Richmond, and G. W. Yohe, “Climate Change Impacts in the United States: The Third National Climate Assessment” (U.S. Global Change Research Program: 2014), available at: http://nca2014.globalchange.gov/report/sectors/water.
  108. G. Sahoo and others, “The Response of Lake Tahoe to Climate Change” Climatic Change (2012), available at http://tenaya.ucsd.edu/tioga/pdffiles/tahoe_clchange_sahoo_etal_2012.pdf; see also University of California, Davis Tahoe Environmental Research Center, “Tahoe : State of the Lake Report 2014” (2014), available at: http://terc.ucdavis.edu/stateofthelake/sotl-reports/2014/sotl_2014_complete.pdf.
  109. S. Given and others, “Regional public health cost estimates of contaminated coastal waters: a case study of gastroenteritis at southern California beaches” Environmental Science & Technology 40(16) (2006): 4851-4858, available at: http://www.ncbi.nlm.nih.gov/pubmed/16955877.
  110. M. Kiparsky and P. Gleick, “Climate Change and California Water Resources: A Survey and Summary of the Literature” (Oakland: Pacific Institute, 2003), available at: http://www2.pacinst.org/reports/climate_change_and_california_water_resources.pdf.
  111. Ibid; see also J. Takekawa and others, “Final Report for Sea-level Rise Response Modeling For San Francisco Bay Estuary Tidal Marshes.” (U.S. Geological Survey, 2013), available at: http://pubs.usgs.gov/of/2013/1081/pdf/ofr20131081.pdf.
  112. California Energy Commission, “Total Electricity System Power,” available at http://energyalmanac.ca.gov/electricity/total_system_power.html (last accessed February 2015).
  113. U.S. Department of Energy, “US Energy Sector Vulnerabilities to Climate Change and Extreme Weather,” (2013) available at http://energy.gov/sites/prod/files/2013/07/f2/20130710-Energy-Sector-Vulnerabilities-Report.pdf.
  114. U.S. Department of Energy, “US Energy Sector Vulnerabilities to Climate Change and Extreme Weather,” (2013) available at http://energy.gov/sites/prod/files/2013/07/f2/20130710-Energy-Sector-Vulnerabilities-Report.pdf.
  115. P. Gleick, “Huffington Post: When Our Responses to Drought Make Things Worse,” available at http://pacinst.org/huffington-post-when-our-responses-to-drought-make-things-worse/ (last accessed February 2015); see also U.S. Department of Energy, “US Energy Sector Vulnerabilities to Climate Change and Extreme Weather”
  116. U.S. Department of Energy, “US Energy Sector Vulnerabilities to Climate Change and Extreme Weather”
  117. California Sierra Nevada Conservancy, “The Rim Fire: Why Investing in Forest Health Equals Investing in the Health of California,” available at http://www.sierranevada.ca.gov/factsheets/10.31rimfirefactsheet.pdf.
  118. U.S. Department of Energy, “US Energy Sector Vulnerabilities to Climate Change and Extreme Weather”
  119. NOAA, “NOAA’s State of the Coast”
  120. M. Heberger and others, “The Impacts of Sea-level Rise on the California Coast” (California Climate Change Center, 2009), available at: http://pacinst.org/wp-content/uploads/sites/21/2014/04/sea-level-rise.pdf.
  121. M. Heberger and others, “The Impacts of Sea-level Rise on the San Francisco Bay” (Oakland: Pacific Institute, 2012), available at http://www.energy.ca.gov/2012publications/CEC-500-2012-014/CEC-500-2012-014.pdf.
  122. Port of Oakland, “Informational Report to the Oakland Board of Port Commissioners,” (2013), available at: http://www.portofoakland.com/pdf/environment/EnvInfoReport.pdf.
  123. M. Heberger and others, “The Impacts of Sea-level Rise on the California Coast”
  124. Natural Resources Agency, “Safeguarding California: Reducing Climate Risk”
  125. American Lung Association, “State of the Air 2014,” available at http://www.stateoftheair.org/.
  126. California Climate Change Center, “Our Changing Climate: Assessing the Risks to California” (2006), available at http://meteora.ucsd.edu/cap/pdffiles/CA_climate_Scenarios.pdf.
  127. Ibid; see also U.S. Environmental Protection Agency, “2008 Ground-level Ozone Standards — Region 9 Final Designations, April 2012,” available at http://www.epa.gov/ozonedesignations/2008standards/final/region9f.htm (last accessed February 2015).
  128. California Climate Change Center “Our Changing Climate: Assessing the Risks to California”
  129. M. Milet and others, “Asthma in California: A Surveillance Report,” (Richmond: California Department of Public Health, 2013), available at http://www.cdph.ca.gov/programs/ohsep/Documents/Asthma_in_California2013.pdf.
  130. R. Delfino and others, “The relationship of respiratory and cardiovascular hospital admissions to the southern California wildfires of 2003,” Occupational and Environmental Medicine, 66(3) (2009): 189-197, available at: http://www.ncbi.nlm.nih.gov/pubmed/19017694.
  131. K. Knowlton and others, “Six Climate Change-Related Events in the United States Accounted for about $14 Billion in Lost Lives and Health Costs,” Health Affairs 30(11) (2011): 2167-2176, available at: http://content.healthaffairs.org/content/30/11/2167.full.
  132. C. Walthall and others, “Climate Change and Agriculture in the United States: Effects and Adaptation,” (Washington, DC: USDA, 2012), available at http://www.usda.gov/oce/climate_change/effects_2012/CC%20and%20Agriculture%20Report%20%2802-04-2013%29b.pdf.
  133. J. Fishman and others, “An investigation of widespread ozone damage to the soybean crop in the upper Midwest determined from ground-based and satellite measurements” Atmospheric Environment 44(18) (2010): 2248- 2256, available at http://www.sciencedirect.com/science/article/pii/S1352231010000415.
  134. C. Walthall and others, “Climate Change and Agriculture in the United States: Effects and Adaptation”

Share this post

Stay informed

Your email address will never be given to third parties. All of our emails contain an “unsubscribe” link.

Close

Connect with us

Media inquiries General inquiries