
Overview
Motivation and Context
The original Pathways to Deep Decarbonization in the United States report presented four cases where the United States achieves an 80 percent greenhouse gas (GHG) reduction below 1990 levels by 20501. These cases focused on the performance of low-carbon energy systems using conservative technological and societal assumptions. Specifically, they were constrained by 12 design principles, including: (1) consistent, conservative activity levels, where the level of energy service demand corresponds to an economy and lifestyle similar to that of today; and (2) technological conservatism, where low-carbon technology deployment is limited to commercially demonstrated or near-commercial technologies, and conservative cost and performance assumptions are assumed2. Applying these design principles to the cases allayed a broad range of concerns surrounding the technical feasibility and economic affordability of realizing a deeply decarbonized energy system, such as the need for revolutionary technological improvements or disruptive lifestyle changes.
Given this basis, there is additional value in identifying opportunities for innovation across the energy system, which could facilitate deep decarbonization. One promising area of innovation is in the passenger transportation sector, where autonomous vehicle (AV) technology offers the possibility of significant societal benefits, including safer travel, improved mobility and reduced congestion, fuel use and emissions3. AVs can play a leading role in transforming the transportation sector, a significant source of emissions and energy system costs, through a number of improvements over conventional vehicle ownership and use, including: (a) improving the efficiency of travel with optimized vehicle acceleration, braking and routing decisions; (b) enabling the deployment of lighter vehicles due to improved safety; (c) removing barriers to car sharing and transforming transportation from a privately owned asset to an on-demand service; and (d) facilitating the adoption of electric vehicles, as AVs can refuel while unattended and their economics improve as per-mile costs decrease due to higher utilization.
This study supplements the original Deep Decarbonization Pathways Project cases by estimating the value of a passenger transportation sector characterized by high levels of AVs and their contributions towards achieving deep decarbonization. In particular, we estimate key energy use, emissions, infrastructure and cost metrics for a Passenger Transportation Innovation Case and compare them against the same metrics from the original DDPP cases. Given that the technology and policy surrounding AVs is in its infancy, the results from this study helps inform the implications of pursuing AVs as a means of achieving deep GHG reductions.
Background on Autonomous Vehicles
AVs include vehicles whose operations are partially or completely controlled by computer programs. The U.S. National Highway Traffic Safety Administration (NHTSA) defines five levels of vehicle automation characterizing the progression of AV technology4:
- Level 0, No-Automation: A human driver is in complete control of the vehicle at all times.
- Level 1, Function-specific Automation: One control function is automated.
- Level 2, Combined Function Automation: At least two control functions are automated in unison.
- Level 3, Limited Self-Driving Automation: The human driver can generally cede control and engage in other activities, but is expected to be occasionally be available for control.
- Level 4, Full Self-Driving Automation: Fully autonomous car which can drive itself without a human driver.
While interest in AVs dates back to 1939, technological and market developments over the past 15 years increasingly indicate a potential future where transport shifts from conventional, fully human-driven vehicles (Level 0) to cars which drive themselves (Level 4). The 2004 DARPA Grand Challenge, which was created to spur innovation in AV technology, offered a $1 million prize for teams which could navigate a 150-mile route in a rural environment5. Zero teams were able to finish the route; the furthest traveled slightly more than seven miles. However, five teams successfully completed the route in the following year, and six teams completed the third DARPA Grand Challenge in 2007, which took place in an urban environment.
AV technology has continued to advance since the DARPA Grand Challenges, particularly among technology companies. For example, Google’s fleet of self-driving cars has self-driven more than 2 million miles in California, Texas, Washington and Arizona6. Traditional automakers recognize the disruption posed by AV technology towards the personal car ownership model and have made inroads towards a shared autonomous transportation future. For instance, General Motors announced it would invest $500 million in Lyft, a ride-hailing company, in January 20167. This was followed by an announcement in May 2016 that the two companies will begin testing a fleet of autonomous electric taxis on public roads8.
These developments present challenges to today’s conventional transportation system, which is characterized by: (a) high levels of private car ownership; (b) low vehicle utilization (i.e., vehicles are idle approximately 95 percent of the time); (c) large supporting infrastructure ( parking lots); and (d) high social costs (externalities), including accidents, congestion, noise, pollution and GHG emissions9.
AVs could greatly reduce the inefficiencies imposed by human drivers and facilitate positive changes in energy use and environmental outcomes. They could substantially reduce crashes, which are largely due to human error10. Mobility would be enhanced for groups not actively driving, including the disabled, elderly and young. Road congestion could be reduced due to improved traffic flow and fewer accidents. Energy use from AVs is expected to be less relative to conventional vehicles, because increased safety allows for vehicles to weigh less and the size of vehicles is expected to be “right-sized” (i.e., smaller) to match individual trip requirements11.
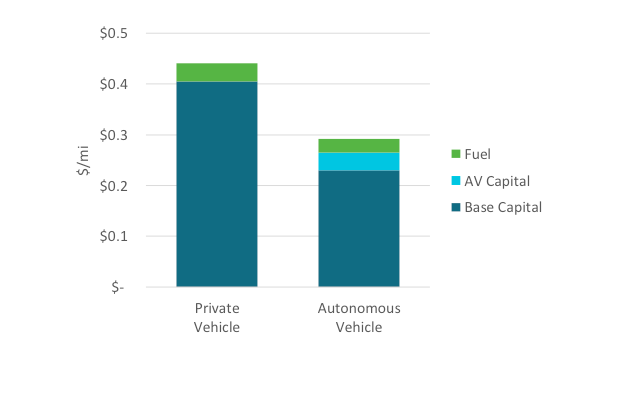
AV technology is expected to be coupled with ride-sharing services (as opposed to a privately owned AV), where a driverless vehicle could be hailed on-demand using a smartphone application and constantly ferry passengers to their destination without the need for the passenger to return the vehicle. Fleets of AVs could replace existing cars, taxis and buses with fewer vehicles, reducing transportation costs12. Coupling AV technology with ride-sharing has important implications for battery electric vehicles (BEV), which have suffered from tepid sales due to the high per-mile cost of personally owning and operating the vehicle. Shared autonomous BEVs would be driven more frequently than personally-owned BEVs, resulting in lower per-mile costs. Figure 1 illustrates this difference in BEV economics by comparing the per-mile cost of a private and autonomous BEV driven 12,000 and 60,000 miles per year, respectively. Higher vehicle utilization offsets incremental AV capital costs.
Figure 1. Comparison of Battery Electric Vehicle Per Mile Cost by Component
Assumptions and Approach
EnergyPATHWAYS Model Overview
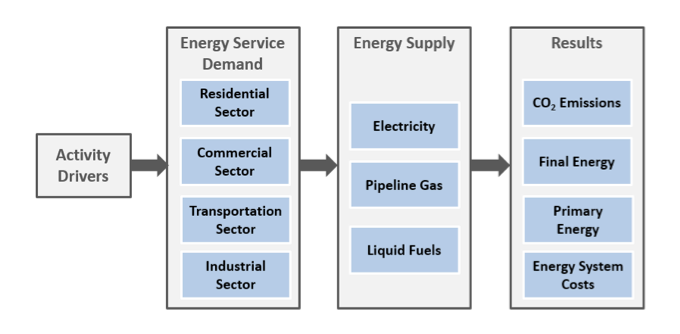
We use the EnergyPATHWAYS model to estimate the value of a passenger transportation sector characterized by high levels of AVs and their contributions towards achieving deep decarbonization. EnergyPATHWAYS is a bottom-up, stock rollover model of the U.S. energy system which tracks final and primary energy use, CO2 emissions, and energy system costs across four end-use sector modules (commercial, industrial, residential, and transportation), as shown in Figure 2 below. Energy demand in these four sectors is supplied by electricity, pipeline gas and liquid fuel modules. The electricity module includes an hourly dispatch of regional power systems to ensure that electricity reliability requirements are met and that the costs of balancing electric generation and load are accurately accounted for.
Energy service demand in each end-use sector module is driven by exogenous activity drivers. In the commercial and residential sectors, these include building floor space, population, households and residential square footage. In the transportation sector, activities are based primarily on travel distance (VMT). In the industrial sector, they are based on economic output (value of shipments).
Figure 2. EnergyPATHWAYS Model Structure
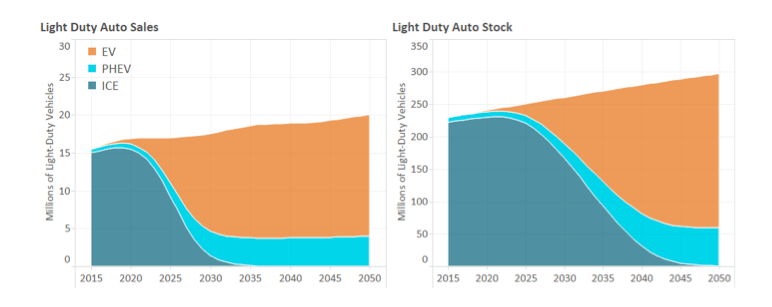
Measures, such as energy efficiency and low-carbon electricity, are incorporated through a stock rollover process. At the end of each year, some amount of energy supply, distribution equipment, buildings and end use equipment (“energy infrastructure”) is retired, based on a survival function. New energy infrastructure is needed to replace this retiring infrastructure and meet potential growth in energy service demand. Measures are implemented by changing the composition of new energy infrastructure and by parameterizing an adoption curve for each measure, which moderates changes in the stock of infrastructure over time. Figure 3 illustrates this process for light-duty vehicles, where the left-hand side shows sales in each year and the right-hand side shows the total stock. In this example, the measure includes specified sales shares of plug-in hybrid and electric vehicles.
Figure 3. Light Duty Automobile Sales and Stock by Year
Passenger Transportation Innovation Case Study Assumptions
For the purposes of this case study, AVs are defined as:
- Fully autonomous (i.e., level 4), without any need for a human driver;
- Battery electric vehicles (EV);
- Light-duty automobiles, including both cars and trucks; and
- Shared, meaning that the vehicles are operated by a fleet operator (not privately owned) and provide rides as an on-demand service.
It is important to note that since AVs are still in a testing phase, their characteristics, such as cost and performance, are not precise and potential interactions with and impacts on the energy system are complex and uncertain. Therefore, we define a few key parameters to characterize AVs, which provide an understanding of the relationship of our assumptions to the results and facilitates alternative assumptions. These key parameters include: (1) vehicle efficiency; (2) vehicle utilization; (3) vehicle lifetime; (4) vehicle costs; (5) adoption timeline and penetration; and (6) incremental, systemwide VMT.
We assume a 45 percent improvement in vehicle efficiency, relative to non-autonomous, battery-electric LDVs. This is based on Greenblatt and Saxena’s 2015 finding that average BEV energy use of right-sized, autonomous EVs utilize 55 percent of the energy of conventional EVs13. This results in AVs with a fuel economy exceeding 200 miles per gallon gasoline equivalent (GGE).
AVs are assumed to travel five times the annual VMT of privately owned light-duty vehicles. In 2014, LDVs traveled approximately 12,000 miles per year on average, which would result in an AV traveling 60,000 miles per year on average. This annual vehicle utilization assumption is comparable to the average annual distance traveled by taxis in U.S. cities: 64,600 miles per year in New York (2005); 70,000 miles per year in Denver (2012); and 90,000 miles per year in San Francisco (2012)14.
Due to the increased utilization of AVs, we assume their lifetime is lower than their conventional counterparts. We assume an average vehicle lifetime of three years for AVs, based on a lifetime VMT of 180,000 divided by an annual utilization of 60,000 miles per year, as described above. Conventional light-duty vehicles, which have an annual utilization of approximately 12,000 miles per year, are assumed to have an average lifetime of 15 years. In other words, all LDVs are assumed to have the same lifetime VMT (180,000 miles) irrespective of their annual utilization and whether they are autonomous or not. AVs may be able to operate beyond this lifetime VMT assumption, which would extend the vehicle’s lifetime and reduce vehicle sales.
We assume an incremental capital cost of $10,000 for AV technology in 2025 declining to $5,000 in 2050, based on a diverse set of sources. Fagnant and Kockelman (2015) report incremental capital costs of $10,000 per AV at a 10 percent market share, declining to $3,000 per AV at a 90 percent market share. IHS Automotive (2014) reports incremental costs of $7,000 to $10,000 in 2025 and $3,000 to $4,000 in 2035, while Morgan Stanley (2013) reports an incremental cost of $10,000 at 2016 prices.
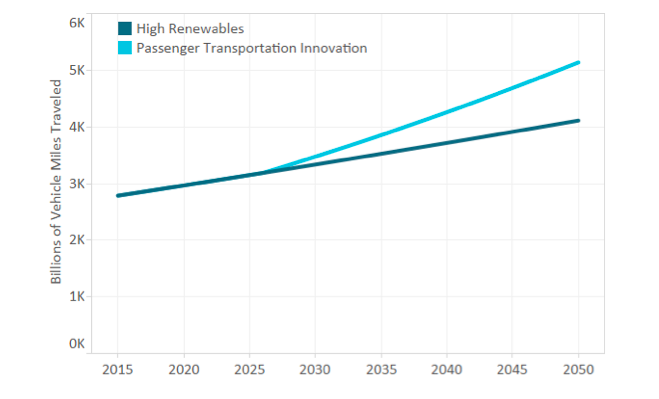
To evaluate a significant market penetration of AVs, we modify LDV sales so that AVs meet 75 percent of all LDV VMT in 2050. The remaining VMT is meant to represent the portion of travel that may be difficult (or unwilling) to automate, and this travel is met by an equal share of PHEVs and EVs. We assume total LDV VMT increases by 25 percent in the Passenger Transportation Innovation Case relative to baseline levels, as depicted in Figure 4. This incremental VMT, which we assume is driven by improved mobility and induced demand from the lower cost of travel, increases linearly to capture the network effect of automation.
Figure 4. Light-Duty Vehicle Miles Traveled Assumptions
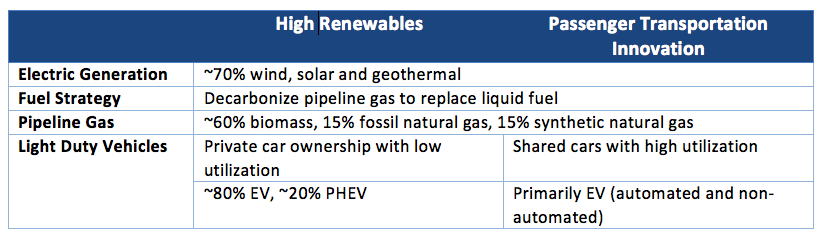
Outside of the light-duty vehicle demand subsector, all assumptions for the Passenger Transportation Innovation Case Study are based on the High Renewables Case. Table 1 below summarizes high-level energy system assumptions for both cases.
Table 1. Deep Decarbonization Case Summary
Results
In this section, we summarize our primary vehicle fleet, emissions, energy use and cost results. We compare results from the Passenger Transportation Innovation Case against the High Renewables Case (transport sub-section) to illustrate the impact of innovation relative to conservative technological deployment. Our primary finding is that AVs can reduce both the cost of realizing deep decarbonization and the number of vehicles on the road, despite higher vehicle costs and increased vehicle miles traveled.
Light-Duty Vehicle Fleet Metrics
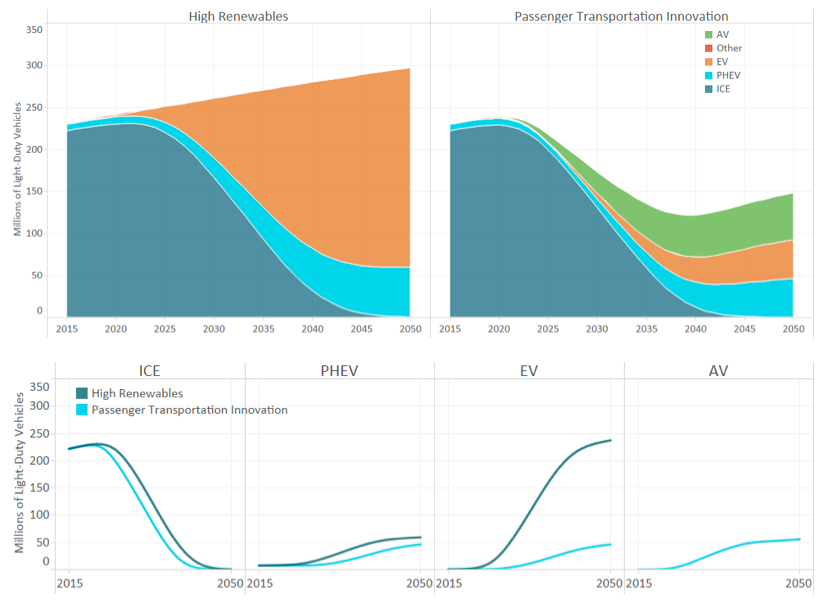
The evolution of the LDV stock from present day through 2050 is summarized in Figure 5. The top panel shows the fleet-wide stock and the bottom panel separately details the stock of ICE, PHEV, EV and AV technologies. Under baseline assumptions, the U.S. LDV stock will grow from approximately 230 million vehicles in 2015 to 300 million in 2050. Higher vehicle utilization assumptions in the Passenger Transportation Innovation Case halves the number of vehicles on the road in 2050, resulting in approximately 150 million vehicles in 2050. AVs accelerate the phase-out of ICE vehicles relative to baseline results and push out and lower the level of adoption of non-automated EVs and PHEVs.
Figure 5. Light-Duty Vehicle Stock by Technology Type
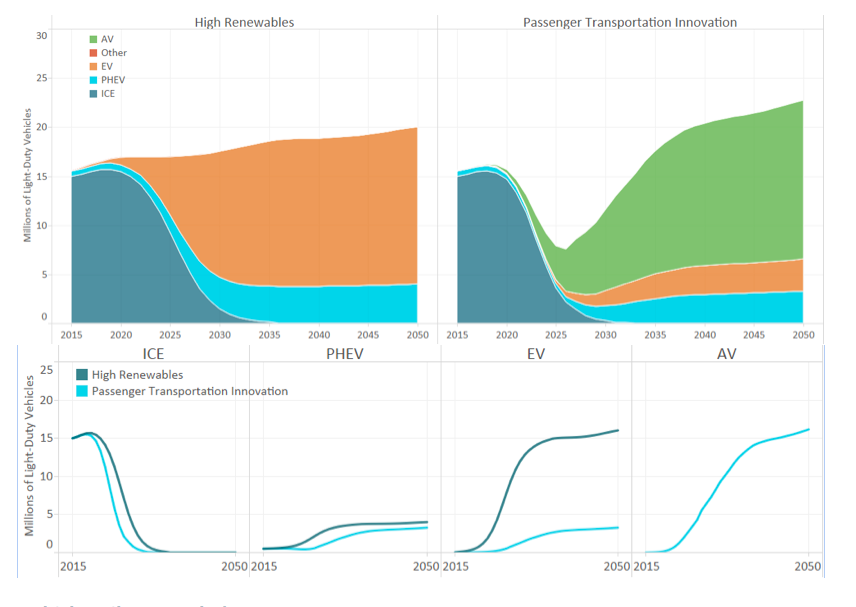
Changes in the LDV stock are primarily driven by the composition of new vehicle sales, as shown in Figure 6. Over the study period, LDV sales gradually increase from approximately 15 million to 20 million in the High Renewables Case. The introduction of AVs in the Passenger Transportation Case results in the collapse of total LDV sales throughout the 2020-2025 period, as highly utilized AVs enter the market prior to meaningful VMT increases, reducing the need for new, non-automated vehicles. This impact is transient, and LDV sales rebound and even exceed baseline values beginning in the mid-2030s due to three factors: (1) existing gasoline ICE vehicles begin to retire; (2) incremental VMT becomes significant; and (3) the short lifetime of AVs, due to their high usage, requires more frequent replacement. Reducing overall vehicle stocks doesn’t necessarily, in the long run, reduce vehicle sales. What matters is the nature of vehicle obsolescence (i.e., how much is due to age versus wear and tear). This is often confused in the discussion of autonomous vehicle impacts.
Figure 6. Light-Duty Vehicle Sales by Technology Type
Vehicle Miles Traveled
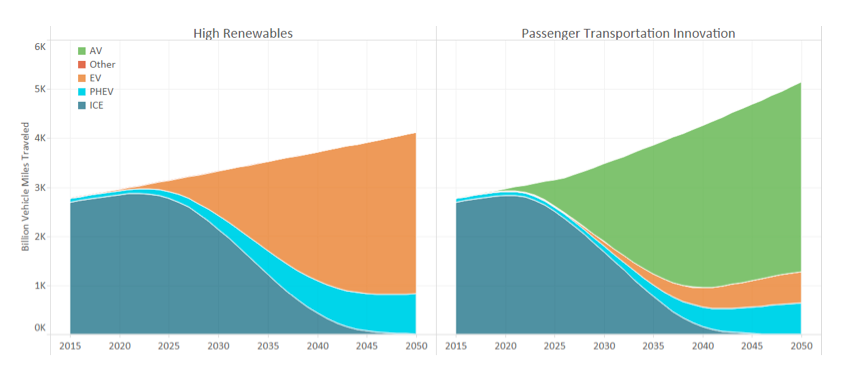
AVs on the road alter both the level of VMT and the share of technologies supplying energy service demand. As shown in Figure 7, total VMT in the Passenger Transportation Innovation Case is 25 percent higher in 2050 relative to the High Renewables Case, due to the assumption that AVs enable mobility among currently underserved populations as well as induce demand due to the lower cost of travel. Forty-five percent of all light-duty travel will be provided by AVs in 2030. This share increases to 75 percent in 2050, with the remaining energy service demand split between non-automated PHEVs and EVs.
Figure 7. Light-Duty Vehicle Miles Traveled by Technology Type
Final Energy Demand
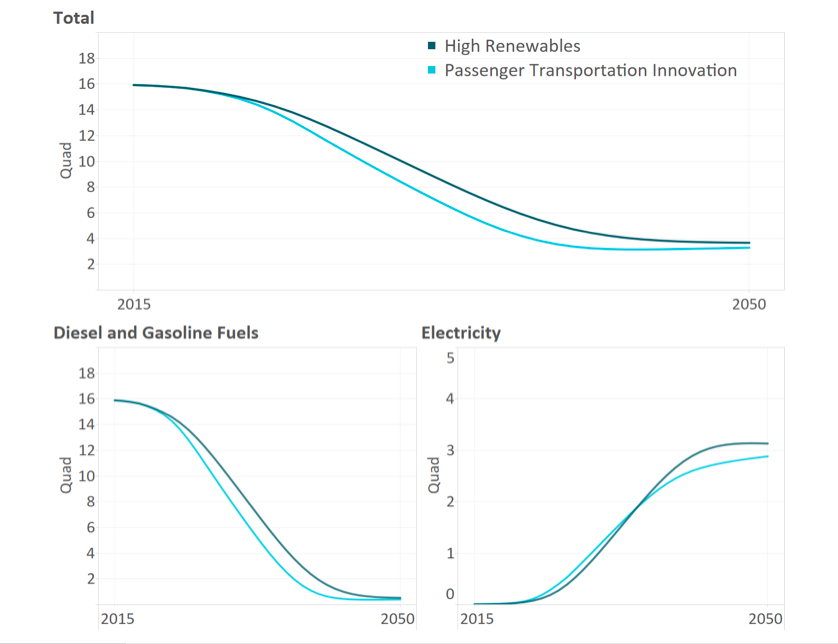
Figure 8 shows total final energy demand from LDVs falling from about 16 quads in 2015 to approximately 3.5 quads in 2050 for both cases. During the intermediate years, final energy demand is lower in the Passenger Transportation Innovation Case primarily due to AVs lowering the stock and VMT supplied by ICE and PHEV vehicles, resulting in less gasoline consumption, as depicted in the bottom left panel. Final energy demand converges in both cases due to gasoline largely being eliminated from LDVs, although final energy demand is slightly lower in the Passenger Transportation Innovation Case due to fewer PHEVs and highly efficient AVs (relative to conventional EVs). This finding allays fears presented by other researchers that the incremental VMT induced by AVs will increase energy use (and greenhouse gas emissions)15.
Figure 8. Final Energy Demand from Light-Duty Vehicles
CO2 Emissions
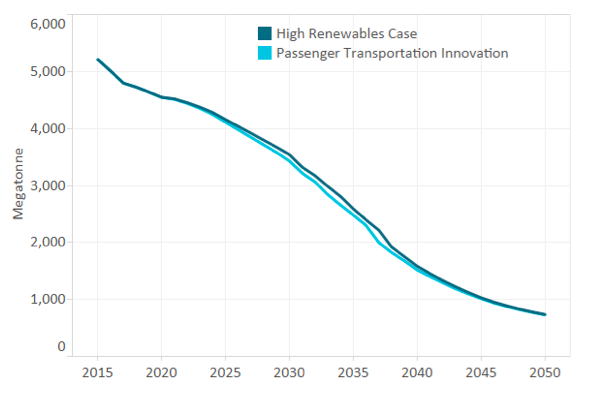
Energy-related CO2 emissions in both cases are below 750 MtCO2 or 1.7 tCO2 per person by 2050, as shown in Figure 9. Intermediate emissions in the Passenger Transportation Innovation Case are lower than the High Renewables Case (approximately 110 MtCO2 less in 2030) due to lower PHEV gasoline consumption, and only slightly lower (~8 M MtCO2) in 2050.
Figure 9. Energy-Related CO2 Emissions
Energy System Costs
Incremental energy system costs, defined as the cost of producing, distributing and consuming energy in a decarbonized energy system relative to that of a reference case system, serves as our primary metric to assess the cost of realizing deep reductions in energy-related CO2 emission. The High Renewables Case, one of four deep decarbonization cases using conservative technological assumptions, shows positive incremental energy system costs through 2050, as shown in Figure 10. Incremental costs associated with LDVs represent the single largest cost component, particularly in the mid-term, but AVs present an opportunity to reduce the incremental costs imposed by decarbonizing transportation and actually achieve cost savings (i.e., lower spending than the Reference Case). By 2050, the incremental cost of the Passenger Transportation Innovation Case is -$133 billion, a $364 billion reduction relative to the High Renewables Case.
Figure 10. Incremental Energy System Costs
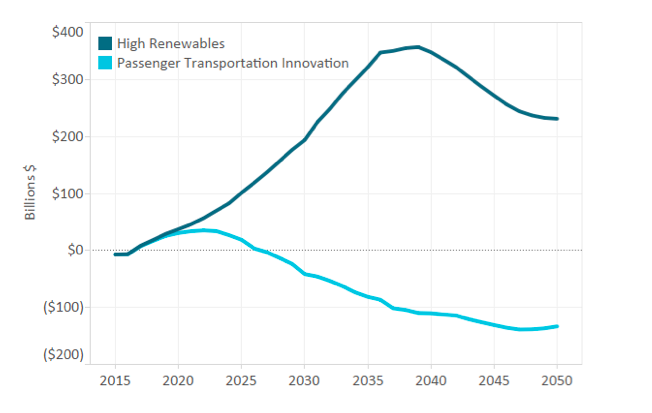
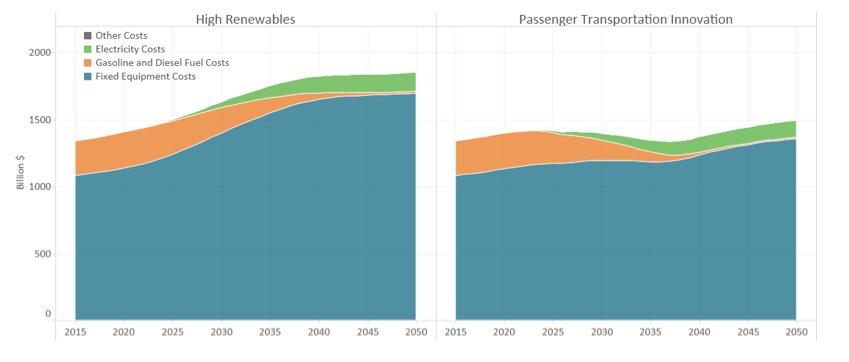
Figure 11 summarizes the components of energy system costs associated with light duty vehicles, including fixed equipment (vehicle) costs, fossil fuel costs and electricity costs. Note that costs are levelized and gross (i.e., not incremental to the Reference Case). Annual cost savings in the Passenger Transportation Innovation Case are overwhelming due to lower fixed equipment costs relative to the High Renewables Case (approximately $200 billion lower in 2030 and $340 billion lower in 2050).
Figure 11. Light Duty-Related Energy System Costs by Component
It is important to note that the annual fixed equipment cost savings are primarily due to lower interest payments, as opposed to smaller principal payments. This is primarily driven by two case study assumptions: (1) vehicles are financed over their lifetime; and (2) vehicle lifetime is tied to lifetime VMT. Since AVs are assumed to have a higher annual vehicle utilization but the same lifetime VMT as their conventional LDV counterparts, they have both shorter physical lifetime and shorter financing periods (i.e., three years). Shorter physical lifetimes result in the AV stock being turned over frequently, requiring similar to higher sales than in the High Renewables Case despite a smaller stock, as depicted in Figure 6 above. Shorter financing periods lowers the amount of interest paid over the payment period.
To better understand this result, we provide an illustrative calculation of the annualized capital cost of a conventional and autonomous electric vehicle, as shown in Table 216. Per-mile principal costs are higher for the autonomous vehicle due to the incremental capital cost of AV technology. However, the per-mile interest payment is approximately 75 percent lower, resulting in net cost savings. This simplified example is not a study result and ignores the dynamic impacts in EnergyPATHWAYS, such as stock-rollover.
Table 2. Illustrative Electric Vehicle Annualized Capital Cost
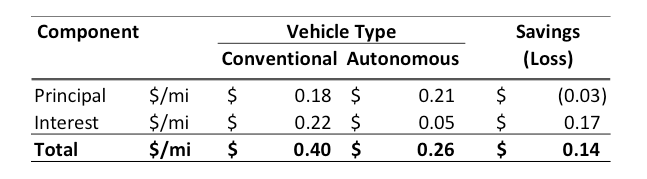
Our finding that cost savings are primarily driven by shorter financing periods is a direct result of the lifetime and utilization assumptions we have discussed in detail above. If we assume higher lifetime VMT and longer lifetimes for AVs, then we would still expect a similar level of cost savings, but they would be driven by smaller principal payments due to fewer sales, rather than lower interest payments. In addition, we expect additional cost savings to come from other sources not modeled. For example, AVs are likely to be financed by fleet operators who have lower borrowing costs relative to households, which would further decrease the cost of financing the investment.
Implications
In this case study, we identify considerable value from autonomous vehicles in achieving decarbonization targets. AVs offer the promise of encouraging the adoption of electric vehicles, a key deep decarbonization technology, by increasing their utilization, which prioritizes efficiency for vehicle owners (and fleet operators). Currently, the very high efficiency of electric vehicles does not translate into fuel cost savings large enough to offset higher fixed costs for private ownership and use, which is a major barrier to widespread adoption. However, a transition from private ICE ownership to shared autonomous electric vehicles operating in a decarbonized energy system would have a revolutionary impact on carbon emissions and energy costs. Any potential risk of higher VMTs, from a carbon perspective, is a second-order effect. The primary imperative for the LDV fleet in a decarbonized system is to switch to zero-emission vehicles like EVs or FCVs, not to reduce miles traveled.
While the positive impact on deep decarbonization is significant, this analysis also poses serious questions to a variety of stakeholders in passenger transportation:
- The transient dip in vehicle sales poses a threat to U.S. automakers while the long-term trajectory actually offers opportunity. The imperative for efficiency in AVs may provide more incentive for shorter-term investment in EV or FCV technologies. Changing vehicle utilization may alter the fundamental design of vehicles in terms of expected obsolescence, etc.
- AV fleets may change the need for EV charging investment in terms of location, scale and charging speed requirements. This would potentially prioritize large-scale fleet charging configurations over in-home charging solutions.
- The potentially rapid rise in electrified vehicle miles has implications for utilities and other electric service providers who are planning grid infrastructure investments. Not only is the potential pace of this growth important for grid planners, but the charging locations on the grid are likely to be significantly different. While EV charging is currently concentrated on residential distribution feeders, this is unlikely to be the case in a high AV scenario. This may allow for more optimal charging locations on the grid.
Understanding the full range of implications of AV technology will require additional study beyond the scope of this analysis. However, this analysis does indicate that the potential impacts are likely to be significant and that leveraging the potential deployment of AV technology should be a high priority for regions aiming to decarbonize their energy sectors.