This section discusses system-level implementation challenges that would arise in pursuing the clean energy pathways. Much of the discussion focuses on the electricity sector due to the expansion and changes needed in that sector.
We begin with an analysis of the needed scale-up of deployment of various clean energy technologies. We then explore a more complex set of challenges that are likely to require more fundamental changes to the structure, governance, and operation of clean energy and transportation systems. Solving the complex challenges, such as operating a reliable grid with higher levels of intermittent resources that are also nearly all low or zero marginal cost resources, will require innovative approaches in both policies and markets. A smarter, more flexible transmission and distribution system will also be required. We then turn to the transformation of the transportation sector that is required for all the clean energy pathways. Finally, we address the challenge of mobilizing sufficient capital and how the timing and coordination of such investments may be managed during the transition. These implementation challenges are real, but we conclude that they are not insurmountable.
Scaling Up Deployment of Low- and Zero-Carbon Power Generation
All of the clean energy pathways would require a major ramp-up in low- and zero-carbon power generation. Different technologies would play different roles in each of the clean energy pathways, and the specific investment patterns would vary across regions.
On a national basis, Table A-3-1 (below) shows the average annual generating capacity additions from 2020-2050 for the High-Carbon Reference Case and the four pathways for 16 types of power plants.
Table A-3-2 (below) shows the change in average annual generating capacity additions from 2020-2050 for the High-Carbon Reference Case and the four pathways for 16 types of power plants.
Table A-3-2.
Change from High-Carbon Reference Case: Average Annual Generating Capacity Additions (2020-2050)
Source:
PATHWAYS output
Table A-3-1 indicates that the High-Carbon Reference Case projects an annual average of 41 GW of new power plant construction for 2020-2025. The four pathways show higher averages of 57 to 114 GW. Though not depicted in these two tables, the year-by-year additions would be fairly steady throughout the 2020-2050 period. The one exception is CCS in the High CCS pathway. This technology is assumed to become cost-effective later than other technologies, and therefore it grows more rapidly in the late 2030s and early 2040s, before growing at a slower rate through the rest of the 2040s.
Table A-3-2 shows how the change in capacity additions for gas and coal plants without CCS would be negative, and how the low- and zero-carbon power plants add capacity faster than in the High Carbon Reference Case. Solar, wind, and nuclear power all grow faster, while the change in gas and coal plants with CCS would go from zero to 6.5 GW and 10.2 GW per year in the Mixed Resources and High CCS pathways, respectively.
These tables indicate how much faster clean energy technologies must be deployed in the electricity sector to achieve the CO2 emissions target by 2050. In the sections below, we consider whether such ramp-ups in construction are feasible, using the average annual build rates in the table as a reasonable approximation. For comparison, we compare these projected rates with average historical rates of power plant construction by technology in the U.S. and other nations.
Wind
Installed onshore wind generating capacity grew from 6 GW at the end of 2003 to 74 GW at the end of 2015, averaging 5.64 GW per year of new installed capacity1. This is well below the expansion required under the High CCS pathway (18.7 GW or wind per year), and well below the number of plants per year required under the High Nuclear (41.3 GW) or High Renewables (42.3 GW) pathways. The Mixed Resources pathway requires more than four times the 2003-2014 average rate of construction (24.8 GW per year). However, during the year of highest wind construction seen in the U.S. so far (2012), propelled by expected changes in tax incentives, the U.S. wind industry installed an average of 13.1 GW per year. Roughly doubling that peak rate from 2012 would meet the Mixed Resources pathway, while more than tripling that rate would be needed to achieve the High Renewables or High Nuclear pathway build rates.
Offshore wind would be required in addition to the on-shore wind development summarized above. The offshore wind industry is well developed in Europe but is only now beginning construction on its first projects in the U.S. The High CCS pathway requires 4.7 GW per year of offshore wind, the Mixed Resources pathway requires 9.1 GW per year, the High Nuclear pathway requires 12.8 GW per year, and the High Renewables pathway requires 14.7 GW per year.
The Renewable Electricity Futures Study (REF)2 examines whether high levels of renewable energy penetration can feasibly and economically be achieved while meeting transmission reliability standards. The central scenario of that study shows that transmission grid reliability can be maintained with 80% renewable energy penetration by 2050. In that scenario, total wind power capacity is about 400 GW by 2050, or an average construction rate of 9.4 GW per year (which is below the peak year of 2012 and only half the construction required under the High CCS pathway). The Wind Vision report was designed to be roughly in line with the Renewable Electricity Futures Study, and shows that there are no major land or wind resource constraints that make achieving this level of installed wind capacity technically or economically infeasible3. Based on past experiences in the U.S. and globally, the Wind Vision report concludes that manufacturing, construction, and employment supply chains could be ramped up quickly to the level needed to meet Wind Vision and REF capacity. It should be noted that the REF and Wind Vision studies are not examining the U.S.’s ability to achieve specific carbon emissions reduction goals and therefore do not make assumptions about electrification of transportation or other sectors. The reports are built around the assumption that 2050 electricity demand will be about the same as today’s, whereas the electricity demands in all of our clean energy pathways are significantly higher than today’s levels. The REF analysis therefore does not address possible constraints on development of wind capacity at the levels of the pathways modeled for this report.
There are many challenges that must be overcome to build high levels of wind power capacity in the U.S. Some are physical; others are related to policies. As turbine components get bigger, the logistical challenges of making, transporting, storing, and installing them increases. Successfully integrating wind power into the grid will require the additional flexibility noted in the section below on the transmission and distribution system. While wind power can be co-located with many other land uses, wildlife and public needs must be accommodated4. Policies that have been created to increase the competitiveness of renewable energy have had inconsistent support (for instance, the PTC often was not extended before it was scheduled to expire) and thus have not allowed developers a long planning horizon. This increases uncertainty, risk, the cost of capital, and the installed cost of wind power in the U.S.
The main constraint on meeting very high levels of new wind construction is the capacity to deliver that electricity reliably to customers. Transmission and other infrastructure issues will be discussed at more length later in this section.
Solar
The U.S. installed more than 7 GW of new photovoltaic (PV) solar capacity and about 7.3 GW of total solar (including concentrating solar power (CSP)) capacity in 20155. Capacity additions in 2015 brought total U.S. solar capacity to more than 27.6 GW. It would require a significant ramp-up to meet the annual installation targets for the Mixed Resources (14.3 GW per year) and High Nuclear (23.9 GW per year) pathways. To meet the High Renewables pathway target (32.6 GW per year), construction would have to be nearly five times the 2015 installation rate. The High CCS pathway would involve a ramping down to just 4.8 GW of new solar per year. All of these figures include both utility-scale and distributed rooftop PVs and CSP (which is not included in any of the clean energy pathways but plays a prominent role in the REF study due to CSP’s flexibility).
In its central scenario, the REF study has U.S. solar capacity growing to 297 GW by 2050, 58% of which is projected to be utility-scale or rooftop PV and 42% of which is projected to be CSP. That study shows that there are no major resource or supply chain constraints to achieving this level of installed solar capacity, which is an average of 19 GW per year, in line with growth rates that we are already seeing6. Because of modeling constraints, NREL’s assumptions in REF about rooftop PV are not dynamic. The study assumes 85 GW of rooftop PV capacity in most scenarios. To capture the fact that rooftop PV has the ability to bypass the transmission grid, the REF study contains one scenario with “constrained transmission,” and double the amount of rooftop PV. Other studies, such as Reinventing Fire, rely much more heavily on distributed generation from rooftop solar, combined heat and power (CHP), fuel cells, and small-scale wind7. Following the distributed generation pathway requires far less investment in new transmission compared to the central power generation scenario. But it would require greater investments in new grid (or micro-grid) technologies that provide more control over the flow of electricity, allowing power to move in both directions across the grid and providing more options for adjusting demand when needed.
The REF study, combined with the SunShot Vision study, concludes that there are no significant constraints to developing and deploying PV solar at the scales required under the Mixed Resources, High Nuclear, or High CCS pathways. There is no independent analysis of whether such constraints may exist at the higher levels of installation required for the High Renewables pathway, but global PV production should be able to accommodate such increases in the U.S.
Biomass
Total installed U.S. generating capacity in 2013 from wood and wood-derived fuel sources was 9.5 GW, and other biomass generating capacity totaled 5.8 GW. That added up to a nameplate capacity of 15.3 GW and a summer net generating capacity of 13.4 GW8. The high-carbon Reference Case projects modest expansion of 0.3 GW per year while none of the clean energy pathways calls for expanding biomass generating capacity from 2020 to 20509.
Geothermal
Total installed U.S. geothermal generating capacity in 2013 was 3.8 GW, with a summer net generating capacity of 2.5 GW10. The high-carbon Reference Case calls for expanding that capacity by about 0.3 GW per year. Annual geothermal capacity expansion would therefore be around 8% per year. The High CCS pathway doubles that rate of construction to 0.6 GW per year, the Mixed Resources pathway increases it to 0.8 GW per year, the High Renewables pathway requires 0.9 GW per year, and the High Nuclear pathway would expand geothermal by 1.1 GW per year. The latter three would all represent significant increases over the existing geothermal capacity.
Depending on the rest of the portfolio mix of generating resources, baseload geothermal generation could displace the need for other capacity that would operate with either low capacity factors (making the capital cost of such capacity high per MWh) or with higher fuel costs (increasing the total system costs of generation). In those cases, higher levels of geothermal generation would be cost-effective and, if policies recognized those benefits, geothermal plants would likely be developed and operated11.
The REF study estimates that about 36 GW of hydrothermal geothermal resource are available to be developed. Of that, approximately 24–25 GW of total geothermal capacity would be online by 2050 in most scenarios. The cumulative additions in the clean energy pathways (18-33 GW from 2020-2050) are therefore not significantly greater than the range of new geothermal capacity in the REF scenarios.
Hydro
Historical hydroelectric development has gone through distinct periods for three types of power plants: (1) projects designed specifically for power generation, (2) power plants associated with large-scale dams and reservoirs designed primarily for water supply development and flood control, and (3) smaller projects developed under PURPA as run-of-river or on existing dam sites. Total installed U.S. conventional hydroelectric generating capacity in 2013 was 78.8 GW plus 21.6 GW of pumped-storage hydro capacity for a total of 100.4 GW12. All four clean energy pathways call for expanding dispatchable hydro capacity by 1.4-1.6 GW per year from 2020-2050, which is consistent with the projection (1.4 GW per year) in the high-carbon Reference Case. An additional 0.1 GW per year of run-of-river hydro capacity would be developed under both the Reference case and all four of the clean energy pathways. Total annual hydropower capacity expansion would therefore be only 1.5% to 1.7% per year in the clean energy pathways. However, the clean energy pathways also include some pre-2020 hydropower development.
Resource assessments in the REF study give no reason to doubt that this amount of new hydropower resource is available. Cumulative installed capacity for hydropower in the REF model, including the capacity of conventional hydropower that is currently operational (79 GW in 2013), ranged from 81–174 GW by 2050 depending on assumptions about the costs of other renewable generation options, electricity demand, and transmission capacity.
Nuclear
U.S. nuclear operating summer capacity grew from 9 GW in 1971 to 100 GW in 1990, where it has plateaued since13. Annual nuclear capacity additions averaged 4.3 GW in both the 1970s and the 1980s. The Mixed Resources pathway calls for 5.6 GW per year of new nuclear construction, while the High Nuclear pathway requires 8.7 GW per year14. Nuclear construction would therefore have to be roughly 30% greater than the historical 1970-1990 rate in the Mixed Resources pathway and nearly double this historical rate in the High Nuclear pathway. (The 3 GW per year in the High Renewables and High CCS pathways would be less). For comparison, China expanded its nuclear power capacity nearly tenfold from 2.3 GW before 2000 to 26 GW by the end of 2015, averaging about 1.5-2 GW per year15. However, nuclear power plant construction in the U.S. occurs in a very different regulatory environment that is subject to greater regulatory licensing, litigation, and financing risk than is the Chinese nuclear industry.
Even the existing U.S. nuclear fleet faces serious operating constraints in the current regulatory environment. These challenges are discussed in the Nuclear Power section of Appendix A-2.
Natural Gas
Total U.S. generating capacity for natural gas-fired generators was 488 GW in 2013 with a net summer capacity of 425 GW16. This followed a dramatic expansion in natural gas-fired electric generating capacity from 2000 to 2014, with annual additions of roughly 25 GW in 2000, 27 GW in 2001, and 55 GW in 200217. The Mixed Resources pathway requires 6 GW of new non-CCS plus 6.5 GW of natural gas-fired CCS capacity per year. This total of 12.5 GW per year compares with 19.4 GW of new capacity per year that is non-CCS natural gas-fired in the High Carbon Reference Case. The High CCS pathway requires 4.9 GW of new non-CCS and 5.1 GW of natural gas CCS capacity per year for a total of 10 GW of new gas-fired capacity. The High Nuclear pathway relies on 6.8 GW of new non-CCS natural gas capacity per year, and the High Renewables pathway constructs 11.4 GW per year. Unlike the Mixed Resources and High CCS pathways, neither of the latter two pathways includes any CCS natural gas capacity.
All of these pathways are well within the historical range of non-CCS natural gas-fired generating capacity expansion experience, but incorporating CCS into these natural gas plants adds another layer of complexity and cost. Sustaining such a high level of construction of CCS plants for three decades is also a bigger challenge than maintaining historical peak construction periods of non-CCS natural gas plants over much shorter periods of time.
Coal
Coal-fired generating capacity in the U.S. had a nameplate rating of 330 GW and a summer net capacity of 303 GW in 201318, but that capacity has been declining in the face of: (1) low natural gas prices and rapid expansion of the natural gas-fired generating fleet; (2) increasing financial and regulatory risk for coal-fired generation; and (3) significant expansion of renewables because of both supportive policies and declining costs. The High CCS pathway includes 5.1 GW of coal-fired CCS capacity per year, which is comparable to the High Carbon Reference Case (5.9 GW per year of non-CCS coal-fired capacity per year). The High CCS pathway also includes 0.8 GW of new coal-fired plants without CCS per year, but none of the other clean energy pathways includes any new coal-fired generating capacity (either with or without CCS).
Summary
Each of the clean energy pathways faces challenges in scaling-up production and maintaining the siting, permitting, and construction pace over more than three decades that would be needed to build the electric generating infrastructure of a clean energy American economy. Total electric generating capacity additions under the clean energy pathways would be 38% higher than in the Reference Case for the High CCS pathway and nearly three times the rate of the Reference Case for the High Renewables pathway. Even the Mixed Resources pathway requires the U.S. nuclear industry nearly to double its highest historical rate of development, and the High Nuclear pathway requires a construction pace that has never been seen in the U.S. Similarly, the rapid recent rate of wind and solar development in the U.S. would need to be doubled to quintupled to meet the targets for some of the clean energy pathways. Hydropower, biomass, and geothermal expansion would be moderate under both the High Carbon Reference Case and all of the clean energy pathways. Natural gas power plant expansion (with CCS) would be well within historical rates of construction for non-CCS generating plants, but CCS will add complexity and challenges. The same is true for coal-fired facilities (which would only be built under the High CCS pathway).
These data summarize only the pace of power plant construction required. Overall investment in a clean energy economy will be much broader than only for electricity generation, though, and there are specific challenges associated with other investments and the transformation of the transportation sector that are quite different than those in the electricity sector. Each of those other challenges is discussed below after addressing the challenge of ensuring grid reliability.
All of the clean energy paths would rely more heavily on renewable energy than do today’s electric grids. Because of the intermittent nature of wind and solar PV generation, some critics argue that renewable electricity is unreliable.
However, while fossil-fired generators are more controllable than renewable generators, their output also is variable in some ways. All technologies face forced outages, scheduled maintenance, or transmission constraints on generation. System operators also deal with variability on the demand side. Demand can be forecasted, but is subject to change.
The challenge of integrating intermittent and variable electricity generation is therefore not a fundamentally new problem for the industry19. Intermittent load and generation are already managed by system operators. In fact, the PJM grid is already managing net load variability through direct participation by Demand Response (DR) resources competing with generators20.
What is new, however, is the operational challenge of accommodating high levels of renewables. The grid must be able to handle variable power outputs on shorter time scales and with less predictability in a renewables-dominated grid than in a power system dominated by fossil fuel or nuclear plants. Some aspects of renewable generation are actually very predictable (e.g., we know when the sun comes up and goes down) but we have much less forecasting confidence for other aspects (e.g., when a cloud may pass over a solar generator).
But grid operators already have many tools for maintaining the match between supply and demand—in large part because they already are adept at predicting and managing big, rapid changes in load. Load is highly variable, with less predictability than the availability of fossil-fired output. One important method of coping with this variability is maintaining a diverse portfolio of customers—both in the types of customers and in their geographic locations21. While demand plunges at the auto factory when the shift ends (when plants aren’t being run around the clock), residential demand then jumps as workers come home and switch on lights and TVs. Moreover, the evening rise in demand typically occurs an hour later one time zone to the west.
Similarly, having a diverse portfolio of renewable generating resources dampens the variability from individual wind or solar plants22. Wind turbines in Wyoming may operate when Columbia River wind farms are off-line, for example, while a cloud passing over a solar plant in the New Mexico desert won’t simultaneously dim the output from all of the other solar plants in Arizona and Texas. And in many areas, the wind blows most strongly at night while solar plants generate their power during the day. Resource and geographic diversity thus reduce both variability and uncertainty23. As a result, renewable sources are best integrated when the grid is being dispatched across a larger and more diverse area24. Transmission is therefore an important component of renewables integration.
Most renewable technologies also can’t be ramped up and down like natural gas turbines or many hydropower generators, and are thus considered “non-dispatchable” 25. The same is true for baseload nuclear and coal-fired CCS plants. As a result, there is more variable “net load” with a high penetration of renewable generation that must be met by other dispatchable generating resources. This increased variability in the net load may then require higher ramp rates, higher capacity reserves, increased electricity storage, and lower capacity factors, which may decrease the operating efficiencies (and therefore increase the costs) of the dispatchable resources. All of these technical solutions raise the economic costs of operating the system, either by (1) keeping capacity with ramping flexibility idle and standing by in order to run during relatively short ramping periods, or (2) curtailing low marginal cost resources. The latter may also decrease operating efficiencies, increase wear and tear and maintenance costs, and decrease generating unit reliability if frequently cycled or operated at sub-optimal levels. The latter is particularly problematic for baseload nuclear, CCS coal, and geothermal plants.
The California Independent System Operator (CAISO) has found that so much solar power is now being generated during the typical peak period of demand in the afternoon that net load actually drops, only to rise again quickly when the sun goes down, resulting in the so-called duck back curve for net load shown in Figure A-3-126. To help cope with these changes in net load, California has mandated that utilities add 1.325 GW of storage to the grid by 2020 to capture some of the excess solar power and to increase flexibility. Much more than this amount would be necessary, however, to address the full “ramp.”
Figure A-3-1:.
CAISO net load profile showing duck back curve with higher renewables
Solar output also varies quickly during the day as clouds pass over a photovoltaic power plant. (Concentrating solar power plants have thermal inertia and storage, so this issue is less critical for them). The result is that dispatchable generators must ramp output up and down quickly27. Wind is also generally not timed to match the historical load peaks or the net load peaks, and high concentrations of wind production in a few key areas (e.g., the Columbia River area) have led to transmission congestion that may limit getting that wind production to customers28.
NREL, utility grid operators, and other researchers have studied these challenges extensively, both through modeling and through the actual experience of integrating an increasing number and fraction of renewable generating resources into operating grids. The REF study is the most comprehensive integration analysis. It models grid reliability with renewables penetration ranging from 10% to 90% (with an 80% target receiving the most detailed analysis). The Western Governors Association (WGA) also commissioned a study to evaluate policy options to improve the efficiency and reduce the costs of integrating high levels of renewable generation into the western grid29. The WGA report emphasizes institutional innovations rather than technical solutions in order to reduce the total system costs of integrating more renewables30.
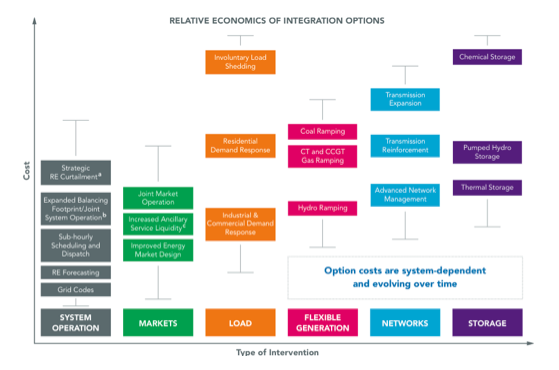
There are many actions that can be taken to increase system flexibility. As shown in the Figure A-3-2 below, “the types of integration span physical (e.g. storage, transmission), operational (e.g., cycling thermal fleets, forecast integration), and institutional (e.g., new market designs, integration of demand response),” according to an NREL report31.
Figure A-3-2.
Types of intervention for grid flexibility
In general, these studies agree that high levels of renewable generation can be cost-effectively integrated into the grid without threatening reliability of the system. We reach the same conclusion for all of the clean energy pathways. As the REF study states:
“The central conclusion of the analysis is that renewable electricity generation from technologies that are commercially available today, in combination with a more flexible electric system, is more than adequate to supply 80% of total U.S. electricity generation in 2050 while meeting electricity demand on an hourly basis in every region of the United States.” (iii)
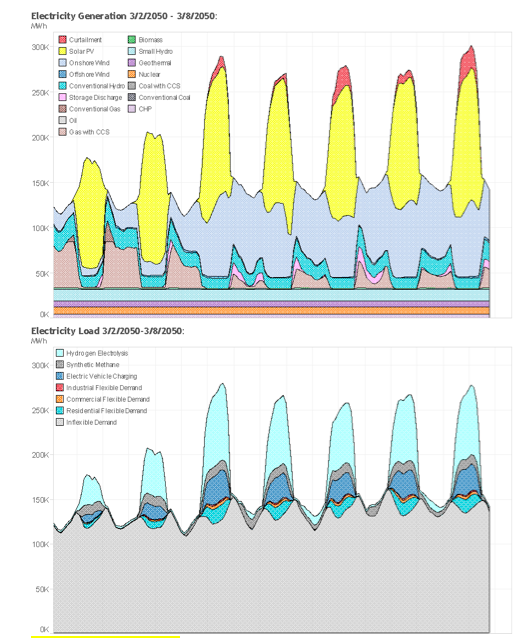
The clean energy pathways must meet the challenge of integrating higher levels of a range of non-fossil-fired technologies, including both renewables and nuclear generation. Figure A-3-3 shows how electricity generation and load would vary in the Western Grid under the Mixed Resources pathway and how flexibility in both generation and demand is required. Note how significant increases in daily solar PV generation (in yellow in the top graph) are managed through a combination of (1) flexible demand response, (2) electric vehicle (EV) charging, and (3) hydrogen electrolysis or the production of synthetic methane. Despite these well-targeted demand management programs, however, the “surplus” renewable generation (in red in the bottom graph) must still be curtailed sometime during high-generation, moderate-load spring days (the simulation is for the first week of March 2050).
Figure A-3-3.
Electricity Dispatch in WECC, Generation and Load, March 2050, Mixed Resources Pathway
Source: DDPP 2015.
Such curtailment is a waste of cheap, clean generation whose costs have already largely been paid through fixed investment. Reducing such curtailment is therefore critical to lower the costs of clean energy pathways.
Indeed, renewables curtailment has already been invoked by many Balancing Area Authorities (BAAs) during similar conditions. The CAISO even projects that power “spilled” from renewables on its system could increase to as much as 35-45% of all renewables generation as California moves from getting 33% of all generation from renewables in 2020 to 50% by 203032. (Such high levels of curtailment are expected to be mitigated by some combination of the strategies summarized below, however.) Without mitigation, California’s near-term challenge could be a nationwide challenge by 2050. The challenge is not limited only to those clean energy pathways with high levels of renewable generation: relying on nuclear power also creates integration issues. In particular, nuclear generators cannot be ramped up or down quickly, so sometimes they also generate excess power that must be managed through the same types of flexibility mechanisms as for renewables. This is one reason that the High Nuclear case includes a higher level of hydrogen fuel cell vehicles: production of hydrogen is a way to utilize the excess nuclear generation33.
More flexibility will also come from applying information technology (IT) to grid operation (see case study, Sec. A-4), creating a “smart grid.” For instance, these technologies will give customers greater control over the timing of their own load. The technologies also make it possible to link the grid to the transportation system, allowing the grid both to charge electric vehicles and to draw on the electricity stored in those EV batteries as needed. (Linking the grid to the transportation system raises other implementation challenges, which are discussed below.)
The REF concludes:
“While this analysis suggests such a high renewable generation future [where 80% of all US electricity is from renewable generating sources] is possible, a transformation of the electricity system would need to occur to make this future a reality. This transformation, involving every element of the grid, from system planning through operation…would likely rely on the development and adoption of technology advances, new operating procedures, evolved business models, and new market rules.” (1)
Electric grid reliability is therefore a challenge that can be overcome with appropriate policies, institutional changes, smart market design, critical investments in transmission infrastructure, and the application of IT to system operation. The process of modernizing the grid can also be accelerated with policy changes or institutional innovations (discussed below) that value ancillary services rather than simply treat every kWh as equal in value to every other kWh34. Current market structures do not adequately value the flexibility required to operate the grid reliably with the level of low- and zero-carbon generating resources needed. But all of the clean energy pathways would ensure high grid reliability if policy-makers address this challenge.
Building a Smarter, More Flexible Transmission and Distribution System
A cost-effective clean energy economy requires a more flexible, more interconnected, and more responsive transmission and distribution (T&D) system than we have today. That means significant new investment to achieve clean energy pathways.
The investment costs of the needed T&D investments are already included in the Pathways model in two ways: (1) General increases in T&D investment for the entire system are proportionate to increases in peak load, while (2) additional technology-specific transmission costs are incorporated into the levelized cost of energy (LCOE) for each renewable technology in the analysis. The projected costs of electricity from solar PV, for instance, include the costs of building transmission lines to bring the solar power to market. T&D, therefore, is not an additional cost beyond what was included in the PATHWAYS model. As a result, the analysis shows that building the transmission system we need is both affordable and achievable.
But this doesn’t mean there aren’t difficult choices and challenges ahead. The exact architecture and details of the best T&D system would vary significantly depending on the path we choose. A future that relies more on large utility-scale renewable generation requires more long-distance high-voltage transmission lines than a distributed generation system does, for instance. The mix of power generation will also determine exactly where new transmission lines will be needed. Implementation of the clean energy pathways therefore requires more detailed analysis of the geography of investment to explore where these investments would make the most sense for the grid. Moreover, the path-dependent need to invest in geographically-specific transmission lines and system upgrades means that policy choices and market responses will need to select a clean energy pathway sooner rather than later. Otherwise, we could waste investments in either generation or transmission that lead to a cul-de-sac rather than a true transformation.
It’s therefore critical that new transmission and distribution investments match up with the mix of clean energy generation that we choose to build35. Timing is also important. Wind and solar projects are already stalling because the transmission lines needed to get their power to markets have yet to be built.
Perhaps the biggest barrier is that new transmission lines are difficult to build in the U.S. Proposed projects typically face strong local opposition, environmental challenges, permitting issues, and regulatory questions around rate recovery and siting authority. This report does not take a position on the policy changes that would best address this issue. But failing to approve and invest in new transmission lines will increase the costs of any of the clean energy pathways.
Meanwhile, utilities are reluctant to invest in local distribution systems that enable more rooftop solar panels and other distributed generation to send power back to the grid, since that cuts utility electricity sales and revenues in the traditional utility business model.
So while the T&D system needed for the clean energy pathways is both technologically feasible and affordable, building it will require sophisticated and judicious changes in current policies. Not making those changes will result in higher costs and lower reliability than is necessary in any of the pathways.
Achieving vastly lower greenhouse gas emissions in the transportation sector requires that vehicle design, fuel supplies, and system operations be altered in fundamental ways.
Vehicle weight must be reduced with advanced materials; conventional drive trains must be replaced with more modern and efficient ones; aerodynamics and rolling resistance must be improved; efficiency must increase with use of information and communication technologies; and better fuels must deliver transport services with much lower emissions per unit of energy consumed.
The most important common link across the pathways is between transportation and the electricity sector, either through direct use of electricity in batteries or through electric fuels (e.g., hydrogen from electrolysis or synthetic methane). This link creates both challenges and opportunities. There has been little coordination of investments across these sectors historically, but the options for reducing electricity sector emissions are less expensive and more numerous than in transport, so allocating more low-emissions electricity and electric fuels to the transportation sector offers significant benefits.
While the mix of electric drive, fuel cells, and biofuels is different in each pathway, these alternatives play vital roles in delivering transportation services where they are most effective. Light-duty vehicles and commuter trains are best switched to electric drive, plug-in hybrids, or fuel cells; medium-duty trucks are best converted to hybrid gasoline electric drive, fuel cells, or compressed natural gas; heavy trucks are shifted to biodiesel or liquefied natural gas; and airplanes to bio jet fuel (already being deployed) or (perhaps in the future) liquid hydrogen.
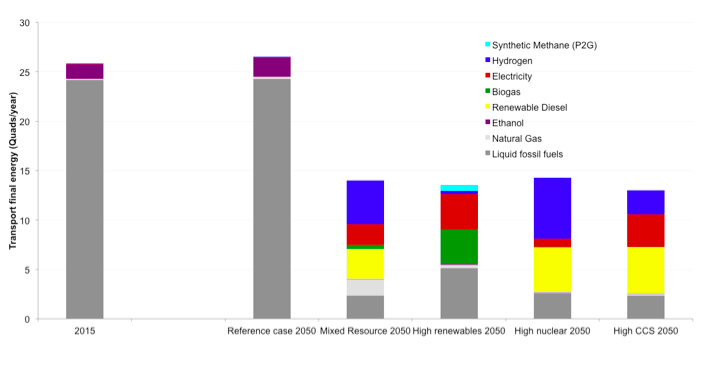
Figure A-3-4 shows final energy for the transport sector by fuel type for 2015, for the High-Carbon Reference Case in 2050, and for the four clean energy pathways in 2050. In the High-Carbon Reference case, conventional liquid fuels such as gasoline, diesel, and jet fuel still dominate, and those fuels show modest growth from now to 2050. Vehicle miles traveled (VMT) per person for light-duty vehicles (LDVs) grows about 14% by 2050, which accounts for a substantial portion of Reference Case growth in final energy demand in this sector.
The clean energy pathways, in contrast, show a transformed transport sector. Final energy demand is cut in almost in half, primarily because of the shift to electricity and hydrogen powered fuel cell vehicles (which results in substantial efficiency improvements in delivering transportation services). LDVs, for example, average the equivalent of more than 100 miles per gallon by 205036. VMT per person for LDVs grows at the same rate in the clean energy pathways as in the High-Carbon Reference Case (14% by 2050).
The shift to electric drive is important for all four clean energy pathways, but has the largest effect for the High Renewables and High CCS pathways. The most important alternative fuels besides electricity are (1) biogas and liquid hydrogen from electrolysis in the Mixed Resources and High Renewables pathways, (2) biodiesel and liquid hydrogen from electrolysis in the High Nuclear pathway, and (3) biodiesel alone in the High CCS pathway. Hydrogen from electrolysis and synthetic methane are two intermediate fuels from the electricity sector, while bio jet fuel, biodiesel, and biogas are produced from biomass.
Figure A-3-4.
Transport sector energy use by fuel type
As some other sectors do, transportation faces a chicken-and-egg problem. Manufacturers don’t want to produce new car types without a guarantee of demand, and customers can’t buy cars that manufacturers don’t offer. Retooling takes time and represents a substantial investment. New materials and technologies are expensive when first deployed, thus impeding adoption. Electric charging stations and hydrogen fueling depots are also far less numerous than conventional gas stations (which are virtually everywhere).
Fortunately, these new technologies offer greater customer amenities while also substantially improving fuel economy. That’s one factor that will help break the log jam. Already, industry is anticipating that consumers will recognize the superiority of electric and hybrid-electric drive trains, with companies like Nissan, GM, Ford, Volvo, Honda, BMW, VW, and Mitsubishi making significant investments. For instance, Volvo’s CEO said, “We are confident that by 2020, 10% of Volvo’s global sales will be electrified cars”37. In early 2016, when GM showed off its new Chevy Bolt electric vehicle, GM CEO Mary Barra emphasized that the company is committed to being a leader in electric and electric-hybrid vehicles38. Ford is investing $4.5 billion in electrified vehicles and will have 13 all-electric or hybrid models by 2020. “We want to make sure that we’re either among the leaders or in a leadership position,” Ford CEO Mark Fields said39. Nearly 400,000 people put down $1000 deposits for Tesla’s forthcoming Model 3 electric sedan. And a study by Bloomberg New Energy Finance forecast that global sales of electric vehicles will hit 41 million by 2040, which would represent 35% of new light-duty vehicle sales40. As part of this trend, manufacturers (along with some utilities) are working to increase deployment of electric charging stations. One advantage of vehicle electrification over hydrogen-fueled vehicles is that the electricity grid is already ubiquitous (while a hydrogen distribution network needs to be built from scratch).
Achieving vastly higher efficiency is critical to transforming the transport sector, and that means big changes in vehicle design. Carbon fiber and advanced metals will compete with conventional materials, requiring new manufacturing techniques and the production of these materials on a much larger scale. Weight reductions made possible by these materials (while maintaining or improving safety) also allow drive trains to be downsized (without reducing acceleration), thus reducing costs and simplifying the task of developing improved electric, hybrid electric, and fuel cell vehicles41.
Better information and communication technology (ICT) will improve traffic flow in all transport modes (and therefore improve system efficiency), but that will require more data collection, better computing, and resolution of some thorny privacy issues. Drivers already experience improved traffic flow through dashboard and cell phone GPS mapping ICT, which highlights areas of congestion and promotes rerouting to reduce individual travel times and improve overall system efficiency. The design process will also be improved and accelerated by the use of new computer tools for “pre-prototype” modeling of product designs and modeling of interactions between electric vehicles and the power grid, to name just two examples. ICT will also enable continually improving high quality video conferencing (“telepresence”), moving bits instead of atoms to achieve virtually instant visual communication between people across town or half a world apart, thus reducing VMT42. Despite such opportunities for reducing VMT, however, all of the clean energy pathways assume that VMT increases the same amount as in the Reference Case (by about 14% by 2050).
The transportation challenge is substantial, but the transformation described in the clean energy pathways will create a transport system with little or no dependence on foreign oil, substantially reduced emissions of pollutants causing direct health effects, much lower greenhouse gas emissions, and superior matching of the transport services people want and need with the best means to give it to them. Better design combined with new materials and clever use of ICT should allow this new transportation system to “deliver the goods” at a direct cost comparable to that of the current system yet with much lower pollution costs.
Overall, we find that the direct costs of this new transportation system are higher than that of the current system—but the benefits include much lower spending on fuel, lower pollution costs, and reduced risks from climate change impacts. Moreover, a major shift to transportation as a service could significantly lower the overall cost of providing transportation compared to today (see discussion in Section A-1).
The Price Paradox: Declining Marginal Value and LCOE
The transition to a clean energy economy will occur over decades, and the initial steps may be based upon incremental policy incentives, technological innovation, and scale economies as deployment expands. We have already seen the benefits of this type of incremental change.
Rapid recent declines in solar PV costs reflect the cumulative effect of a decades-long process that began with early R&D investment (e.g., NASA and the space program), continued with innovation and development of niche markets (e.g., toys and remote sites), and expanded into the utility sector with PURPA (providing fixed-price PPAs and interconnection access) and tax incentives (initially an ITC). Then utility markets expanded (e.g., through the German feed-in-tariff), which led to greater deployment and more cost reductions with expanding production and scaling (e.g., creating fabrication plants in Asia). Those changes helped create a market warranting further corporate investments in R&D as well as competition to drive costs down further (e.g., through competitive PPA tendering to meet state RPS requirements); additional government support for both distributed generation (e.g., through Net Energy Metering rates) and larger-scale utility projects (e.g., through loan guarantees and accelerated permitting or federal leasing); and then consolidation of best industry practices into fewer efficient firms with competitive LCOE. This is a tried-and-true pathway to move a technology from the laboratory to full commercial scale.
But achieving a competitive LCOE is not enough, because incrementally adding a low-cost generating resource such as PV solar or wind has the counterintuitive effect of reducing the value of adding more of the same technology. PV solar is actually worth a lot when first added, because its generating profile overlaps a great deal with the pre-renewables peak demand. However, additional PV solar is worth less and less as PV solar penetration increases in the generating portfolio—the net load peak is shifted from the afternoon to the evening, and the integration costs of managing the grid with more and more solar increase with each additional unit of PV solar. This is especially true if the PV solar is geographically close to other PV solar, because their generation will co-vary and they will be competing for the same transmission lines.
The California Public Utilities Commission (CPUC) has estimated the value of PV solar in the future, and found that its “effective load carrying capacity” (ELCC) is projected to plummet from 2013-2022 in the base case analysis where PV solar accounts for nearly half of new renewables43. This declining ELCC value, and the increasing “integration costs” and curtailment costs, mean that future PV solar projects are likely to have lower payments in new long-term PPAs (as well as short-term market prices) than PV solar PPAs signed just a few years ago. The same is true for wind PPAs.
At the same time, the low LCOE of both wind and PV solar—which is the primary reason those two technologies dominate RPS portfolios throughout the nation—have pushed other renewable technologies (e.g., CSP, geothermal, biomass) out of the generating mix. Most RPS competitions for long-term PPAs have focused on LCOE, while other technologies offer portfolio diversity benefits (both technologically and geographically) and capacity or flexibility benefits that neither wind nor PV solar offer at high levels of renewable penetration. Yet those attributes have not been appropriately valued, so further cost reductions from the scaling associated with commercial deployment have not accrued as quickly as they have for wind and PV solar. The result has been less rapid development of those other technologies that will be essential elements of a robust portfolio.
Finally, the very success of zero- and low-carbon technologies (whether renewables, nuclear, or CCS) will drive down demand for fossil fuels—which will lower the cost of those same fossil fuels. The apparent cost-effectiveness of investment in a clean energy pathway will then appear to be reduced, because the benefit of reduced fossil fuel costs is reduced. We have already seen in the transportation sector how lower gasoline prices lead consumers to buy vehicles that are less fuel-efficient—even when those lower prices are in turn the result of slackened gasoline demand due to improved fuel economy. The same conundrum faces electricity generators.
The problem is acute in places like California, Denmark, and others pushing for a high level of renewables on the grid. Valuing the long-term benefits of a given addition to the portfolio is difficult if estimates of those values (or market signals or dispatch decisions) are based only or primarily on LCOE44. We therefore need to establish long-term value signals beyond LCOE.
A recent study by the Center for Energy Efficiency and Renewable Technologies (CEERT) concluded:
Simply procuring the renewable resource that is “least cost” by the standard metric of LCOE for an individual project will not lead to a least cost system. Furthermore, “best fit” in the current “least cost/best fit” paradigm cannot be assumed to be a simple fixed generic “integration cost adder” for each specific technology or a time of delivery (TOD) multiplier based on historic load shape. What are important at high renewable penetrations is how all of the pieces fit together and complement each other, and how the remaining non- renewable resources (including demand side resources) are utilized45.
The Deep Decarbonization Pathways Project (DDPP), which also relied heavily on PATHWAYS modeling, makes several related points that apply to LCOE-based analysis:
Effective policy begins with questions, observations, and rigorous analysis. Accepting unexamined assumptions can lead to ineffective or counterproductive policies. Many common policy frames and analytical approaches used in energy and climate policy were developed in the context of incremental changes to fossil fuel-dominated energy systems, not an energy transformation…
…In most cases, policies were designed to work within a particular policy environment in the pursuit of short-term goals, generally incremental rather than transformational. While this can be a valid response to circumstances, the policy community must be aware of the difference between what is tactically expedient and what is required for the U.S. to be on the path to deep decarbonization46.
Achieving the transformation from a high-fossil path economy to a clean energy economy pathway requires much more than incremental change, so it will require a total systems approach rather than a marginal approach based on LCOE. Otherwise, the price paradox will undervalue the benefits of the transformation and cut it short too early in the transition to achieve success.
The price paradox is only one of the institutional implementation challenges facing the transformation to a clean energy economy. Another is the existing institutional structure of utility business and regulatory models.
The electricity sector in the U.S. is fragmented. Wholesale transactions are regulated by FERC (but often with deference to market-based determinations of whether reasonable rates have been set by the market), while retail rates are set by some combination of cost-of-service (COS) ratemaking and markets. COS ratemaking is the norm for publicly owned utilities (POUs), but investor-owned utilities (IOUs) operate under a variety of regulatory regimes. Some IOUs are under traditional COS ratemaking by a state public service or public utilities commission; others act as load-serving entities (LSEs) who must procure all of their electricity from non-regulated participants through either PPAs or markets. Those markets may in turn be operated by Regional Transmission Organizations (RTOs) or Independent System Operators (ISOs), but some LSEs may be “islands” within or between RTO/ISOs or other Balancing Area Authorities (BAAs) that are not formally RTO/ISOs under direct FERC jurisdiction (e.g., Bonneville Power Administration in the Pacific Northwest). This mosaic of regulated authority and market operations means that one size definitely does not fit all.
Regardless of the relationship between regulators and markets, though, there is widespread agreement that the electric utility industry is facing a huge challenge as distributed generation (DG) and other changes transform the traditional model of a utility47. Serious discussion of alternative utility business models has now matured into formal legislative and regulatory proposals for reforms. In some cases, utilities and regulators are seeking to decouple profits from sales in order to create incentives for utilities to invest in or promote more energy efficiency, demand response, or DG. In other cases, more radical transformation toward a “transactive” utility that would be a value-added service provider (rather than a commodity retailer) has been proposed48. We are now witnessing the greatest reconsideration of the industry’s regulatory structure since the move to deregulation and restructuring of the 1990s49. New York’s Public Service Commission recently issued an order calling for significant changes along these lines50, and California’s PUC is struggling with the challenges of implementing state legislation calling for ambitious RPS, greenhouse gas emission reduction, and energy efficiency goals by 203051. Meanwhile, many RTO/ISO markets are already innovating to allow greater DR or renewables integration.
We do not take a position here on how utility business models—and the structure of regulation itself—should change to accommodate the challenges of transforming the energy economy52. But we do see development of business models and regulatory structures as critical to resolving the other implementation challenges discussed in this Appendix section. Therefore, getting the institutions right in this arena is its own implementation challenge: If unsuccessful, there will be greater difficulty overcoming the other challenges. The transformation to a clean energy economy will be most evident through the technological changes it produces. But the economics and feasibility of deploying that technology to maintain a reliable electric grid and seamless integration with an electrified or hydrogen fuel cell transportation sector will be determined by the institutional choices regarding regulation, market design, and incentives for stakeholders. Concerted effort is required to design and implement institutional changes adequate to the task.
A clean energy economy is technically feasible, affordable, and within America’s reach by 2050—and achieving it will require a level of incremental investment that is relatively small compared with American mortgage borrowing or other sectors of the U.S. economy.
Moving away from the current path of high fossil fuel dependence would require an additional capital investment53 of $220 billion per year from 2020 to 2030. The added investment would rise to about $410 billion per year in the following decade, then decline to an average of $360 billion per year from 2040 to 2050.
These capital spending increases would amount to about 0.4-2.0% of U.S. GDP between 2020 and 2050 (with GDP growing to roughly $40 trillion in 2050). The total capital investment needed for the clean energy economy would be about 19-20% of GDP from 2020-2050, compared to 18-19% of GDP for staying on the current fossil-fuel dependent path. That additional capital must be mobilized from other sectors of the economy and invested in clean energy options.
While total investment in the clean energy pathways is much higher than in the High-Carbon Reference Case, some of that added cost would be offset by fossil fuel savings throughout the lifetime of those investments. The investments must be made up-front, however, while the savings will accrue over time.
Moreover, existing investment in some technologies (e.g., internal combustion engine vehicles) must be shifted to other technologies (e.g., BEVs, PHEVs, and FCVs) to achieve a clean energy economy. This shift in existing investment is much greater than the incremental increase in total investment that is required for a clean energy economy compared to the High-Carbon Reference Case. Market and policy incentives to support such dramatic shifts are clearly necessary.
American business has shifted investments and mobilized new capital throughout history, of course, to seize technological opportunities and to create new markets. Major investment in mobile phone infrastructure predated widespread handset adoption by at least five years, but it laid the groundwork over two decades for a market estimated at $340 billion in 201554. Total revenues from cell phones now dwarf the old land line business, while the existence of apps and other features in modern smart phones have promoted expanded investment in everything from software to Amazon to Netflix. It is difficult to pin down precisely how much financial capital has been mobilized by the convergence of cellular technology, mobile smart phones, and the Internet—but it is clear that the up-front investments have yielded enormous returns.
Public policies can support or inhibit investment in a clean energy economy. On the positive side, a variety of tax incentives, such as the Investment Tax Credit (ITC) for solar and the Production Tax Credit (PTC) for wind, have recently been extended by Congress. In addition, accelerated depreciation improves the return on investment (ROI) and return on equity (ROE) for many clean energy technologies. However, fossil fuel technologies are also being subsidized through long-standing and deeply-buried tax structures, such as the oil and gas depletion allowance (which allows fossil fuel investors to deduct expenses that exceed their actual investment or expenses) and the use of partnership structures that allow favorable tax treatment for the profits of fossil fuel investors (but are not available to investors in clean energy economy technologies)55. Other subsidies exist for technologies such as nuclear power (e.g., limits on accident liability). All energy technologies compete for investment capital in the context of a complex tax code that favors some technologies more directly, more consistently, and more deeply than others. Reforming the tax code to create a more level playing field for clean energy technologies is essential to help mobilize new capital and to shift existing capital toward those technologies. Keeping the existing tax code, in contrast, will stymie the transformation and limit our ability to mobilize financial capital.
Other policies also play a role. Research and development funding, for example, represents an important public investment to reduce the risks of new technology development for future commercialization. Loan guarantees from DOE have also played an important role in leveraging private investment to bring pilot projects to operational commercial scale. Although much of the DOE’s clean tech funding came from the 2009 stimulus package adopted during the recession, the basic framework for both loan guarantees and grants was already in place beginning in 2005 before the stimulus package56. That structure can still be used to augment commercialization efforts for a portfolio of clean energy technologies—which will then help to mobilize private financial capital into the sector.
Financial and accounting disclosure can also help to mobilize financial capital in the clean energy sector. Full disclosure of the risk of stranded assets due to climate change would prompt many investors to shift their investments from fossil fuel companies to clean energy economy companies. Efforts to encourage such disclosure have already begun. The Financial Stability Board (FSB) has created the Task Force on Climate-related Financial Disclosures (TCFD) to “develop voluntary, consistent climate-related financial risk disclosures for use by companies in providing information to investors, lenders, insurers, and other stakeholders”57. As the FSB argues, such disclosures are necessary to fully understanding the material risks that companies face.
Ratings agencies also need to improve their debt rating methodologies to account for climate risk in order to improve investors’ understanding of the risk of high-carbon investments; concurrently, the development of more standardized products for clean energy technologies will reduce the risk premiums that investors have demanded for less tested new technologies.
Ultimately, though, achieving a clean energy economy will depend on private sector investment and commitment. Private sector investment in the clean economy space has exploded globally. Going forward, it must expand even more. CERES and BNEF have analyzed the global need for capital for a clean energy economy and conclude that raising the necessary capital is well within the capacity of global financial markets. Their report states:58
“A world working to achieve the goals of the Paris Climate Agreement—to limit temperature change to 2oC or below—will see investment in new renewable power generation increase 75% above business-as-usual.”
“Total clean electric power generation infrastructure capex over the next 25 years under a ‘2oC scenario’ presents a $12.1 trillion investment opportunity in total.”
“While the scale of this new investment opportunity is massive, it is dwarfed by the capacity of global financial markets to unleash the needed investment capital, creating extensive new opportunities for commercial financiers, institutional investors and others.”
What is now required, therefore, is a massive acceleration of a transformation that is already well underway. Financial markets can raise the capital required, however, so that is not a constraint.
Hand, M.M.; Baldwin, S.; DeMeo, E.; Reilly, J.M.; Mai, T.; Arent, D.; Porro, G.; Meshek, M.; Sandor, D. Eds.. 2012. “Renewable Electricity Futures Study,” NREL/TP-6A20-52409 (Golden, CO: National Renewable Energy Laboratory), available at http://www.nrel.gov/analysis/re_futures/.
↩
In particular, wind projects must comply with the Endangered Species Act (ESA), Bald and Golden Eagle Protection Act (Eagle Act), and Migratory Bird Treaty Act (MBTA). The U.S. Department of Defense (DoD) also disfavors wind turbines near DoD installations due to radar interference, so some projects have had to be altered if they are near active military air operations.
↩
Some regions have abundant biomass resources, however, and failing to manage some of those resources could increase the risk of catastrophic wildfires—which would then release black carbon, a short-lived carbon pollutant with high global warming potential. Therefore, some analysts have advocated for more aggressive policies to incorporate biomass utilization into climate mitigation strategies due to the indirect benefit of reducing the likely release of black carbon through forest fires. Our analysis did not attempt to quantify or incorporate such benefits from biomass use. Greater biomass utilization would be expected if policies credit biomass for those benefits.
↩
This effect is illustrated with the Low-Carbon Grid Study (LCGS) for California by James R. Caldwell and Liz Anthony, 2016, “The Value of Salton Sea Geothermal Development in California’s Carbon Constrained Future,” Center for Energy Efficiency and Renewable Technologies, March, available at http://lowcarbongrid2030.org/wp-content/uploads/2016/PDFs/160322_Geothermal-Analysis.pdf). The same principles and result should also apply to non-California systems and to non-geothermal baseload generation by nuclear or fossil fuel generation with CCS.
↩
Duane, T.P. and K. H. Griffith. 2013., “Legal, Technical, and Economic Challenges in Integrating Renewable Power Generation into the Electricity Grid,” San Diego Journal of Climate & Energy Law, 4, 1-68.
↩
Duane, T.P., and K. H. Griffith. 2012. “Legal, Technical, and Economic Challenges in Integrating Renewable Power Generation into the Electricity Grid,” 2013, San Diego Journal of Climate & Energy Law, 4, 1-68. Western Governors’ Association, “Meeting Renewable Energy Targets in the West at Least Cost: The Integration Challenge,” available at http://www.uwig.org/variable2012.pdf.
↩
Western Governors’ Association. 2012. “Meeting Renewable Energy Targets in the West at Least Cost: The Integration Challenge,” available at http://www.uwig.org/variable2012.pdf. In Germany, 50% variation in single plant output was reduced to 10% variation for 100 dispersed sites. Ramp rates for solar output were also reduced by 90% for the 100 sites when aggregated compared to ramp rates for individual plants.
↩
National Renewable Energy Laboratory. 2010. “Western Wind and Solar Integration Study,” available at http://www.nrel.gov/grid/wwsis.html. Western Governors’ Association, “Meeting Renewable Energy Targets in the West at Least Cost: The Integration Challenge,” 2012, available at http://www.uwig.org/variable2012.pdf.
↩
Duane, T.P., and K. H. Griffith. 2013. “Legal, Technical, and Economic Challenges in Integrating Renewable Power Generation into the Electricity Grid,” San Diego Journal of Climate & Energy Law, 4, 1-68. National Renewable Energy Laboratory. 2010. “Western Wind and Solar Intergration Study,” available at http://www.nrel.gov/grid/wwsis.html. Western Governors’ Association. 2012. “Meeting Renewable Energy Targets in the West at Least Cost: The Integration Challenge,” available at http://www.uwig.org/variable2012.pdf.
↩
CSP solar is an exception if it has storage that can be drawn down to increase generation and can decrease generation for the grid by storing excess generation output. The NREL REF study therefore relies on CSP for dispatchability with an 80% renewables-powered grid. Current payment schemes generally fail to value such dispatchability, however, so solar development is dominated by PVs without such storage or dispatchability. Also, note that wind and PV solar can be curtailed (i.e., ramped down) and, if already curtailed, can also be ramped up. In both cases, however, there is an economic cost because the variable costs of wind and PV solar are essentially zero.
↩
Rothleder, M. 2012. “Market Analysis and Development,” October 27 presentation to the California State Bar Section Environmental Law Conference at Yosemite. For a more detailed discussion of the issue, see Paul Denholm, P., M. O’Connell, G. Brinkman, and J. Jorgenson, National Renewable Energy Laboratory. 2015. “Overgeneration from Solar Energy in California: A Field Guide to the Duck Chart,” November available at http://www.nrel.gov/docs/fy16osti/65023.pdf.
↩
Rothleder, M. 2012. “Market Analysis and Development,” October 27, presentation to the California State Bar Section Environmental Law Conference at Yosemite; Denholm, P., M. O’Connell, G. Brinkman, and J. Jorgenson, National Renewable Energy Laboratory. 2015. “Overgeneration from Solar Energy in California: A Field Guide to the Duck Chart,” November available at http://www.nrel.gov/docs/fy16osti/65023.pdf.The actual net load has closely matched the predicted shape of the duck curve but evening ramping was less steep during spring 2016 than projected. It is forecast to become much steeper in the future, however. See Fowlie, M. 2016.“The Duck Has Landed,” Energy Institute at Haas, University of California, Berkeley, May 26, available at https://energyathaas.wordpress.com/2016/05/02/the-duck-has-landed/.
↩
Duane, T.P. and K. H. Griffith. 2013. “Legal, Technical, and Economic Challenges in Integrating Renewable Power Generation into the Electricity Grid,” San Diego Journal of Climate & Energy Law, 4, 1-68.
↩
Western Governors’ Association. 2012. “Meeting Renewable Energy Targets in the West at Least Cost: The Integration Challenge,” available at http://www.uwig.org/variable2012.pdf. Duane, T.P. and K. H. Griffith. 2013. “Legal, Technical, and Economic Challenges in Integrating Renewable Power Generation into the Electricity Grid,” San Diego Journal of Climate & Energy Law, 4, 1-68.
↩
Among the potential institutional changes are sub-hourly generation and transmission scheduling, establishment of Energy Imbalance Markets (EIM), and consolidation of balancing area authorities (BAAs). FERC adopted the first of these in FERC Order No. 764 on the Integration of Variable Energy Resources (VER), which took effect in June 2013. Integration of Variable Energy Resources, 139 F.E.R.C. 61,246 (June 22, 2012). The CAISO has established a nascent EIM and is now exploring potential expansion of its BAA to increase integration with other BAAs in the Western Interconnection, but both of CAISO’s initiatives have been controversial among other BAAs in the West.
↩
Cochran, J., and M. Miller, et al. 2014. “Flexibility in 21st Century Power Systems,” National Renewable Energy Laboratory NREL/TP-6A20-61721, May available at http://www.nrel.gov/docs/fy14osti/61721.pdf.
↩
Millar, N. and S.t Barave. 2016. CAISO, “RETI 2.0 TTIG Workshop—CAISO Update” presentation, January 22, Renewable Energy Transmission Initiative 2.0 Docket 15-RETI-02, California Energy Commission.
↩
Existing nuclear generators face the same problem. The Diablo Canyon Nuclear Power Plant, for example, was explicitly designed by PG&E to operate in conjunction with the simultaneously-built Helms Storage Pumped Storage Plant in order to use the “excess” nuclear generation to pump water back uphill during off-peak hours so that the hydropower could be used to meet peak power and flexible ramping needs. Duane, T. P., and K. H. Griffith. 2013. “Legal, Technical, and Economic Challenges in Integrating Renewable Power Generation into the Electricity Grid,” San Diego Journal of Climate & Energy Law, 4, 1-68 at 13.
↩
Duane, T.P. 2010.“Greening the Grid: Implementing Climate Change Policy Through Energy Efficiency, Renewable Portfolio Standards, and Strategic Transmission System Investments,” 34 Vermont Law Review 711-780, Summer.
↩
Rocky Mountain Institute. 2011. “Reinventing Fire: Bold Business Solutions for the New Energy Era,” available at http://www.rmi.org/ReinventingFire.
↩
Changes in social networking and ICT may have a greater disruptive impact on mobility—and, therefore, transportation demand for fossil fuels—than the technical transformation outlined in the clean energy pathways. Groode, T. 2016. IHS Energy presentation, May 16. However, all of the clean energy pathways assume that VMT increases the same as the Reference Case (by about 14% by 2050).
↩
California Public Utilities Commission. 2016. DRAFT 2016 RPS Portfolios presentation (at 13) to RETI 2.0 Plenary Group Meeting, March 18, California Energy Commission Docket 15-RETI-02.
↩
Mills, A. and R. Wiser. 2014. “Strategies for Mitigating the Reduction in Economic Value of Variable Generation with Increasing Penetration Levels,” Lawrence Berkeley National Laboratory. LBNL-6590E. January.
↩
Williams, J.H., B. Haley, et al. 2014. Pathways to Deep Decarbonization in the United States. The U.S. report of the Deep Decarbonization Pathways Project of the Sustainable Development Solutions Network and the Institute for Sustainable Development and International Relations. Revision with technical supplement, Nov 16, 2015. Available at http://deepdecarbonization.org/countries/#united-states ↩
Satchwell, A., P. Cappers, et al. 2015. “A Framework for Organizing Current and Future Electric Utility Regulatory and Business Models,” Lawrence Berkeley National Laboratory. LBNL-181246, June, available at https://emp.lbl.gov/sites/all/files/lbnl-181246_0.pdf.
↩
GridWise Architecture Council. 2015. “GridWise Transactive Energy Framework 1.0,” PNNL-22946 Ver1.0, January, available at http://www.gridwiseac.org/pdfs/te_framework_report_pnnl-22946.pdf. Fox-Penner, P. 2010. Smart Power: Climate Change, the Smart Grid, and the Future of Electric Utilities (Washington: Island Press,).
↩
State of New York Public Service Commission. 2016. Order Adopting a Ratemaking and Utility Revenue Model Policy Framework, 14-M-010 – Proceeding on Motion of the Commission in Regard to Reforming the Energy Vision, May 19.
↩
California Public Utilities Commission. 2016. Rulemaking 16-02-007, Order Instituting Rulemaking to Develop an Electricity Integrated Resource Planning Framework and to Coordinate and Refine Long-term Procurement Planning Requirements, February 19,.
↩
For utilities, LBNL has produced an excellent set of reports in its Future Electric Utility Regulation Series: Lawrence Berkeley National Laboratory, “Future Electric Utility Regulation Series,” available at https://emp.lbl.gov/future-electric-utility-regulation-series (last accessed September 2016). See also Fox-Penner, P., “Smart Power: Climate Change, the Smart Grid, and the Future of Electric Utilities,” (Washington DC: Island Press, 2010). Current policy conflicts are focused on how utilities will recover fixed costs in the face of customer defection through distributed generation (DG), but the core debate for the future is whether utilities will become “energy services” utilities or “integrating” utilities. See Corneli S., and S. Kihm. 2015. “Electric Industry Structure and Regulatory Responses in a High Distributed Energy Resources Future,” Report No. 1 in the Future Electric Utility Regulation Series, LBNL-1003823, November, available at https://emp.lbl.gov/sites/all/files/lbnl-1003823_0.pdf.
↩
All modeling results are expressed in 2014 dollars unless otherwise noted. Results presented here are for the Mixed Resources pathway.
↩
Hardmand, S. and R. Steinberger-Wilckens. 2014. “Mobile phone infrastructure development: Lessons for the development of a hydrogen infrastructure,” International Journal of Hydrogen Energy 39 (16), May 27, Pages 8185–8193, available at http://www.sciencedirect.com/science/article/pii/S0360319914008489.
↩
Payne, H. Forthcoming. “Incenting Green Technology: The Myth of Market-based Commercialization of No- and Low- Carbon Electricity Sources,” New York University Environmental Law Journal, vol. 24(3), 2016. Center for American Progress. 2016. It Is Time to Phase Out 9 Unnecessary Oil and Gas Tax Breaks, May 26. Available at https://cdn.americanprogress.org/wp-content/uploads/2016/05/23134458/OilSubsidies-factsheet.pdf.
↩
Payne, H. Forthcoming. “Incenting Green Technology: The Myth of Market-based Commercialization of No- and Low- Carbon Electricity Sources,” New York University Environmental Law Journal, vol. 24(3), 2016.
↩
Task Force on Climate-related Financial Disclosures, “Our Mission,” available at https://www.fsb-tcfd.org (accessed August 2016).
↩