Appendix

A-2 Technology Cost and Performance Assumptions

The costs of attaining the carbon reduction goals in the PATHWAYS modeling are driven in large part by the assumptions made about the cost and performance of various technologies today and in the future. This section of the Appendix compares PATHWAYS’ cost and performance assumptions for new technologies to similar studies conducted by the U.S. Department of Energy and its labs to see if they lie within mainstream expectations about cost reductions and performance improvements.


In general, after looking at the modeling assumptions in the context of other studies, we find that the PATHWAYS model assumptions and findings are consistent with mid-range expectations in the other recent studies. Some cost reductions must be achieved over the next few decades, but they are not overly optimistic and can likely be achieved with the expected level of R&D investment and deployment expected. However, few studies have projected the high levels of electricity generation needed to meet the aggressive carbon reduction goals, so some deployment feasibility findings are not directly comparable.

PATHWAYS Generation Supply Curve Development

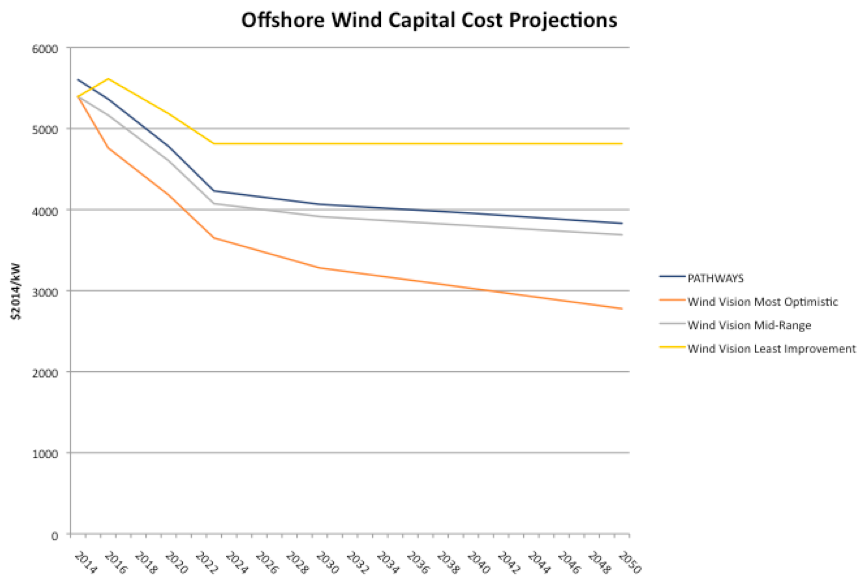
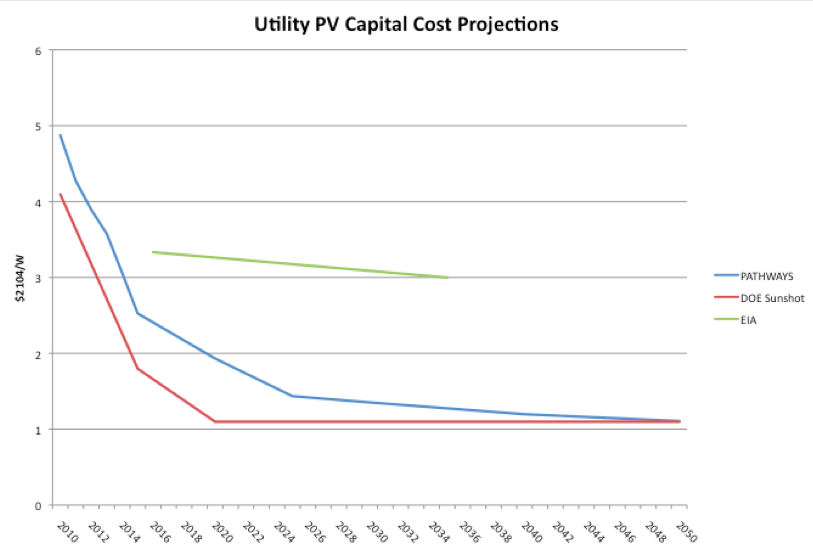
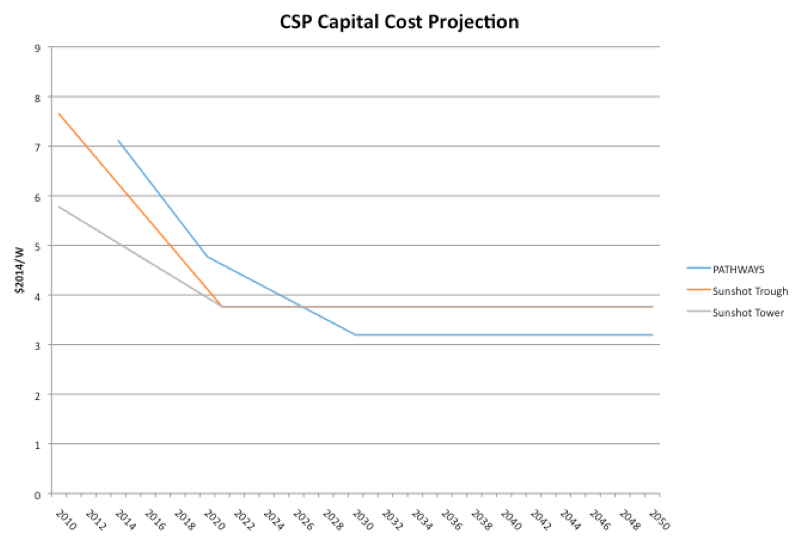
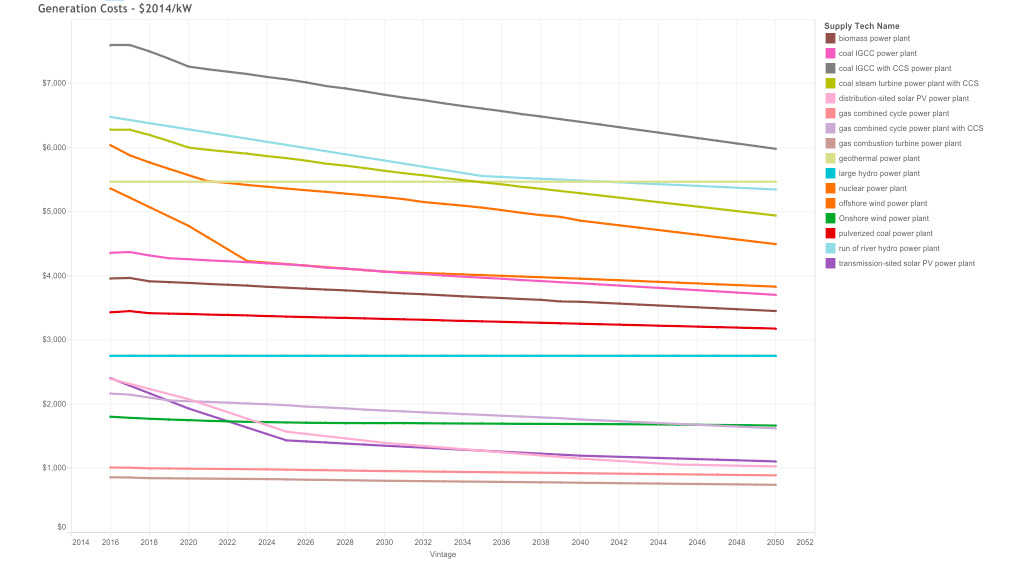
The primary cost for most renewable energy technologies is the upfront capital cost investment. Figure A-2-1 presents the PATHWAYS projections for capital costs (in 2014$) for all generation supply options.

Figure A-2-1. Capital Cost Projections for Power Generation

Capital Cost Projections for Power Generation

The model must also make assumptions about the electricity generating potential for the various technologies. Capacity factor is the most widely used metric to compare technology performance. It is the theoretical capacity of the generator divided by electricity generated over time. One problem with using capacity factor as a metric for comparison is that the technology capability is muddled with other factors, including resource availability and access to transmission.

The PATHWAYS model defines an input capacity factor that is based on the technology capability. Table A-2-1 presents the PATHWAYS assumptions for capacity factors for renewable energy technologies for the modeling period 2016-2050. They are based on technology performance and the low, high, and average value reflect location-specific availability of the resources (e.g., solar insolation, wind speed).

Table A-2-1. Capacity Factors for Renewable Power Generation Options

Technology Low Capacity Factor High Capacity Factor Average Capacity Factor
Rooftop PV 14% 19% 16%
Transmission-sited PV 17% 24% 20%
Large hydro & run-of-river hydro 21% 40% 33%
Offshore Wind (Coastal Areas Only) 29% 46% 37%
Onshore Wind 26% 42% 30%

Potential sites are categorized based on both an estimated quality of the renewable resource and an estimated cost of building the transmission interconnection from that site to access the grid. The PATHWAYS model uses renewable energy supply curves from the EPA’s MARKAL model and compressed the 25 MARKAL bins (five capacity factor bins times five transmission bins) into a weighted average capacity factor of the five transmission bins, with 1 being the easiest and cheapest to build transmission. In this way, the model does not necessarily build out the highest resource areas first, but is constrained by the estimated cost and difficulty of building transmission in that area. No transmission costs are added for distributed resources like rooftop solar.

The output capacity factor is calculated by the model and it reflects what plants the model projects are built, how the plants are constrained (for non-dispatchable technologies), and how the plants are dispatched (for dispatchable technologies). Table A-2-2 presents the the output capacity factors for the major generating technologies in the PATHWAYS study. The first percentage number in each table entry represents the capacity factor in 2016, and the second percentage number represents the capacity factor in 2050. A single percentage number indicates either that there was no change over the modeling period or that the changes in the interim period were slight and the percentage in 2050 had returned to what it was at the beginning of the modeling.

Table A-2-2. Output Capacity Factors for Power Generation Options

Technology High Carbon Reference (2016–2050) Mixed (2016–2050) High Renewable (2016–2050) High Nuclear (2016–2050) High CCS (2016–2050)
Coal 57–83% 40%–2% 41%–5% 40%–6% 42%–58%
Combined-Cycle Gas 70%–33% 85%–60% 86%–14% 85%–36% 86%–59%
Dispatchable Hydro 38% 38% 38%–37% 38% 38%
Nuclear 97% 97%–96% 97%–95% 97%–94% 97%
Offshore Wind 44% 36%–35% 36%–34% 36%–35% 36%
Onshore Wind 34% 34%–31% 34%–31% 34%–32% 34%–32%
Rooftop Solar 17%–16% 17% 17% 17% 17%
Run-of-the-River Hydro 39% 39%–38% 39%–37% 39%–38% 39%
Transmission-sited PV 22% 22%–21% 22%–19% 22%–20% 22%–21%

As these two tables indicate, after technology improvement and resource or grid availability are taken into account, PATHWAYS does not assume increasing capacity factors for wind or solar PV. Wind power sees a slight reduction in capacity factors at higher levels of capacity as the system is forced to constrain its output. In the Mixed Resources, High Renewables, and the High Nuclear Pathways, coal and combined-cycle gas plants show declining capacity factors as their use is ramped down over time.

Other components that go into developing supply curves for each technology are operating costs, including fuel costs when applicable, financing costs, and grid connection costs.

Wind Power

This section focuses on the cost and performance of wind energy.

Land-based Wind

PATHWAYS assumes that land-based wind power technology capital costs are about $1800/kW in 2015 and would slightly decline over time so that they would be less than $1700/kW by 2050. Figure A-2-2 compares these costs to the projections in AEO 2015 and in the Wind Vision report. The Optimistic line is an average over all wind resource levels of the most optimistic cost reduction scenario (Costs were in $2013 in the report but have been inflated to 2014$$ to be comparable). The Mid-Range line is an average over all wind resource levels of the Mid-Range improvement scenario, and No Change assumes no capital cost improvement.

Figure A-2-2. Onshore Wind Capital Cost Projections

Onshore Wind Capital Cost Projections

The studies used for comparison for wind technology cost and performance assumptions are the 2015 Wind Technologies Market Report1. (WTMR) and the Offshore Wind Technologies Market Report2, which provide details on cost and performance observations for existing plants, and the Wind Vision Appendix on Wind Power Technology Cost and Performance Assumptions, which details various technology improvement scenarios based on a literature review of cost reduction potential3. The Department of Energy’s Energy Information Administration’s (EIA) assumption is also provided when available4. EIA projections are usually more conservative than industry expectations, at least in part because capital cost reductions are a function of deployment in the model.

According to the WTMR, the capacity-weighted average capital cost in 2015 was $1,690/kW, with capital costs ranging from about $1300/kW to $2500/kW or higher based on technology type (primarily the length of the blades relative to the size of the generator), the geographic region, and economies of scale and other market forces.

The Department of Energy’s Wind Vision modeling starts from capital costs ranging from $1,641/kW (in $2013) in the lowest cost region and least expensive turbines for projects built in 2014, to $1,758/kW in the higher cost regions with more expensive turbines. (Projects that were not competitive on costs at all were not considered). Projections range from no reduction in cost in the most pessimistic case to an average reduction (over all techno-resource groups) of 5% by 2050 in the mid-range case and about 18% by 2050 in the best case. For example, in the best resource and most optimistic scenario, capital costs are projected to go from an average of $1737/kW to $1421/kW by 2050. In the mid-resource, mid-range scenario, costs are projected to decline from $1737/kW to $1646/kW by 2050.

The EIA AEO 2015 study assumes that land-based wind costs are about $1980 (in $2013) for a project built in 2014, declining by a minimum of 5% by 2035, which would bring capital costs to $1880 by 2035.

Cost reductions in the literature reviewed are primarily driven by R&D advances and by manufacturing and construction efficiencies gained by a higher volume of installations. Technological advances can come from materials and design innovations that allow manufacturers to build larger turbines with longer blades, more robust parts, and better ability to efficiently use the wind resource5. Manufacturing and construction efficiencies are other areas where researchers are exploring potential capital cost reductions. All of these are usually combined in the concept of the “learning rate.” According to the Wind Technologies Market Report, “Considering the full time series of installed cost data …. from 1982 through 2015 …. in conjunction with global cumulative wind power installations over that same period results in a learning rate of 6.5%.” Given onshore wind’s relative technological maturity, it may not be appropriate to apply the same learning curve going forward in the future. Barriers to capital cost reductions are primarily thought to be inconsistent R&D commitment and market uncertainty driven by market & policy changes.

Performance and Cost of Energy

In wind technology, changes in how much electricity each turbine produces must also be considered. Accessing better (often higher altitude) wind sites and increasing the turbine’s rotor swept area can be expected to lower the cost of electricity because each turbine can produce more electricity.

PATHWAYS assumes that onshore wind has an average capacity factor of 30% in 2014, with no technology-based change in capacity factor through the study period.

As documented in the WTMR, taller towers and longer rotors relative to the generating capacity of the turbine (the turbine’s specific power) have tended to increase capacity factors over time. “…[C]apacity factors averaged 32.8% between 2011 and 2015 versus 31.8% between 2006 and 2010 versus 30.3% between 2000 and 2005.” However, competing influences have kept fleet-wide average capacity factors stagnant in recent years. Curtailment, inter-year resource variability, and the trend toward building projects in lower-quality wind sites due to policy drivers and transmission availability have all contributed to lower capacity factors than otherwise could have been expected. The question of how much wind turbine capacity factors can be expected to improve in the future may be a policy question, hinging on how easily transmission capacity can be built and how quickly more efficient wholesale market design features that increase flexibility can be adopted.

Performance improvement projections in the Wind Vision study range from no improvement in the most pessimistic case to an average improvement (over all techno-resource groups) of 23% in the mid-range case from an average capacity factor of 41% to 51% and 30% in the best case from an average capacity factor of 41% to 54%. The most improvements are seen in the lower techno-resource groups, continuing the trend that has been seen in the last decade.

With improvements in capital cost and performance, onshore wind power is currently able to be sold at record low prices. Figure A-2-3 shows average Power Purchase Agreement from onshore wind power plants through 2015 (including subsidies).

Figure A-2-3. Onshore Wind PPA Prices

Onshore Wind PPA Prices

Note: Area of “bubble” is proportional to contract nameplate capacity.

Source: Wiser & Bolinger, “Wind Technologies Market Report 2015”

Cost and performance improvements in the Wind Vision study drive the postulated levelized cost of energy (unsubsidized) lower by an average of “0% by 2050 in the High Cost case; 22% by 2050 in the Mid Cost case; and 37% by 2050 in the Low Cost case.”

Offshore Wind

PATHWAYS assumes that offshore wind power technology capital costs are about $5500/MW in 2015. Offshore wind costs are assumed to quickly decline through 2023 then more gradually drop so that costs are about $3800/MW by 2050. Figure A-2-4 compares these costs to the projections for close-in, shallow sites in the Wind Vision report.

Figure A-2-4. Offshore Wind Capital Cost Projections

Offshore Wind Capital Cost Projections

According to the Offshore Wind Technologies Market Report, the weighted average global capital cost for a 2014 project was $5925/kW.

The Wind Vision study used a capital cost of $5307/kW (in $2013) for close-in sites that could be built with a monopole substructure. The Wind Vision projects that capital costs could be reduced to projections range from $4735/kW for the case with the smallest reduction in cost to $3629/kW in the mid-range case and $2733 in the best case.

In addition to the cost reductions drivers relevant to the onshore wind turbines, experts see a good deal of potential for lower support-structure construction costs, and in the logistical costs to construct and maintain the plant in the offshore environment. Offshore wind is expected to see rapid capital cost declines as the first few projects are built in the U.S., then taper to a slower rate of improvement, as PATHWAYS assumes.

Offshore wind is still expensive relative to land-based wind, but global turbine and support structure improvements and a good offshore wind resource makes it a potentially viable source of energy for the future. Although it is still only about 2% of total wind capacity, installed capacity for offshore wind is growing quickly, from 0.9 GW in 2000 to 8.8 GW by the end of 2014, with cost estimates of about $200/MWh for recent installations. Europe accounts for 91% of all offshore wind capacity.

Performance and Cost of Energy

PATHWAYS projects that offshore wind in coastal areas has an average technology capacity factor of 37% throughout the study period.

In the Wind Vision study, current close-in, shallow offshore projects are assumed to have an average capacity factor of 41% that improves to 45% in the lowest improvement case, to an average of 46% in the mid-range case, and to an average of 47.5% in the best case.

Cost and performance improvements drive the projected levelized cost of energy (unsubsidized) lower by an average of 51% by 2050 for the best offshore sites, from $170-269/MWh (including costs of connecting the project to the transmission grid) to $83-131/MWh by 2050.

Solar Power

This section focuses on the cost and performance of solar energy.

The studies used for comparison for solar technology cost and performance assumptions are Tracking the Sun IX6 and Utility-Scale Solar 20147 for observed cost and performance statistics and the SunShot Vision Study8, its 2016 progress report9, and the EIA Assumptions for AEO 2015 for future cost and performance projections. For future deployment scenarios, the Renewable Electricity Futures (RE Futures) Study10 is referenced.

There are two primary solar electricity technologies: (1) photovoltaic (PV) and (2) concentrating solar power (CSP). PV solar is the more familiar and has generally eclipsed CSP over the past decade, although CSP has been producing commercial power for more than three decades and several high-profile CSP projects have been built recently. The PATHWAYS study relies primarily on PV and uses very little CSP. In contrast, the NREL RE Futures study relies extensively on CSP due to its flexibility and its thermal storage. This section discusses the technology and costs of both PV and CSP to determine the economic and technological viability of solar for powering a clean energy economy.

Photovoltaic (PV)

Photovoltaic solar deployment has increased rapidly in recent years, both globally and in the U.S., reflecting dramatic cost reductions for PV panels (with increased manufacturing scale) and learning-by-doing through expanding installations that have helped to drive down balance-of-system (BOS) costs (e.g., acquiring customers, building support structures, installing panels). PV solar technology is also suitable for either utility-scale or distributed generation (DG) applications on residential, commercial, and industrial rooftops or on support structures over parking lots or fields.

One of the key advantages of PV solar technology is that it can turn both direct and indirect sunlight into electricity (unlike CSP, which requires direct solar insolation). Therefore PV have been deployed successfully in relatively low-insolation settings such as Germany. (Germany has nearly 40 GW of solar capacity installed, producing about 7% of the nation’s annual power needs)11.

Utility-scale solar is generally more cost-effective than smaller-scale distributed solar, but distributed applications have exploded, in part because of attractive Feed-In-Tariff (FIT) terms or net metering policies that effectively pay rooftop PV owners the retail price of power12. The latter is usually calculated to include the full cost of providing utility infrastructure (including the transmission and distribution system, backup generators, administration, and service crews), however, so both utilities and regulators are reconsidering net metering and its implications for the traditional utility business model. Low-cost battery storage systems make questions about utility business models even more pressing. While storage (either utility-scale or distributed) could improve the flexibility for the grid for integrating renewables, it could also allow some customers to bypass the grid entirely to meet most of their needs through DG. This could lead to a so-called death spiral, where the loss of those customers would mean that the fixed costs of the entire grid would need to be borne by fewer customers, driving up the costs for those customers and then potentially driving more customers off the grid. It is clear that the combination of low-cost PV and low-cost storage has the potential to radically disrupt the economics of the traditional utility business model and warrants policy attention.

Cost

Table A-2-3 presents PATHWAYS assumptions for total installed costs for three types of PV systems for 2015 and 2050.

Table A-2-3. Solar Capital Cost Assumptions

Technology Plant Vintage Capital Cost ($/W)
Utility (Transmission-sited) PV 2015 $2.5
2050 $1.1
Commercial (Distribution-sited) PV 2015 $2.5
2050 $1.0
Residential (Rooftop solar) PV 2015 $3.4
2050 $1.2

According to NREL estimates of cost contributions of all contributors, starting costs today are already lower than the PATHWAYS starting cost. Figure A-2-5 below is the NREL bottom-up cost estimation for residential, commercial, and PV system costs, including 2010 costs, today’s costs, and 2020 SunShot goals.

Figure A-2-5. Installed PV System Costs by Type

Installed PV System Costs by Type

Source: “On the Path to SunShot: The Role of Advancements in Solar Photovoltaic Efficiency, Reliability, and Costs”

However, the Tracking the Sun Report displays higher median costs today. For projects in their data sample installed in 2015, “the median installed price was $4.1/W for residential systems, $3.5/W for non-residential systems ≤500 kW in size, and $2.5/W for non-residential systems >500 kW.” That report goes on to say: “By comparison, a number of other recent benchmarks for PV system prices or costs range from $2.7/W to $4.5/W for residential systems, and from $1.7/W to $4.3/W for non-residential systems. Differences between national median prices and these other benchmarks reflect the diversity of underlying data sources, methodologies, and definitions. For example, national median prices are historical in nature, represent prices not costs, are heavily impacted by several large and relatively high-priced state markets, and may be subject to inconsistent reporting practices across installers. The national median prices presented in this report thus should not necessarily be taken as indicative of typical pricing in all contexts, nor should they be considered equivalent to the underlying costs faced by installers.”

Figure A-2-6 compares PATHWAYS capital cost projections to SunShot Vision capital cost goals and the projections in AEO 2015. The SunShot Vision report set a goal of installed capital costs for transmission-sited PV of $1/W by 2020 (inflated to $1.1/kW in 2014$$) $1.5/W for residential systems (inflated to $1.6/W) and $1.25/W for commercial systems (inflated to $1.3/W).

EIA assumes that solar PV project overnight costs are $3.3/W for a 2014 project (in $2013 after a 5% contingency factor is added) and that there will be a minimum 10% learning cost decrease by 2035, which will bring costs down to $2.95/W (The EIA assumptions document does not break solar PV up into market categories).

Figure A-2-6. Utility PV Capital Cost Projections

Utility PV Capital Cost Projections

The historical relationship between PV costs and cumulative production is shown in Figure A-2-7, which plots the log-log relationship between PV costs (in US $/W) and production from 1976-2014, as well as the log-log relationship between Lithium-ion battery costs (in US $/Watt-hour) from 2010-2014. Continued cost declines are therefore highly probable with more production.

Figure A-2-7. Solar PV and Li-Ion battery experience over time

Solar PV and Li-Ion battery experience over time

Prices are in 2014$$.

Source: Presentation by Michael Liebreich at Bloomberg New Energy Finance Summit, April, 2015: https://data.bloomberglp.com/bnef/sites/4/2015/04/BNEF_2014-04-08-ML-Summit-Keynote_Final.pdf .

The lower module and installation costs, in turn, have made it possible to purchase solar power at lower and lower prices. Figure A-2-8 shows the drop in prices for Power Purchase Agreements from 2006-2015.

Figure A-2-8. Levelized PV PPA Prices by Contract Vintage

Levelized PV PPA Prices by Contract Vintage

Source: “Utility-Scale Solar 2015,” Bolinger and Seel

Concentrating Solar Power (CSP)

Concentrating Solar Power is less ubiquitous than rooftop or utility-scale PV solar and therefore generally less familiar to most Americans. PV and CSP technologies were in a tight economic competition during the first decade of this century, but the rapid pace of PV cost declines—together with some siting challenges in scaling-up CSP technology—has given PV solar a decided advantage on a cost-per-MWh basis. PV solar has therefore flourished in a policy environment dominated by (1) net metering for distributed generation (which values only energy on a kWh basis) and (2) renewable portfolio standards (which require utilities to meet a specified percentage of their annual energy needs through renewable sources of generation). Both of these policy structures emphasize the value of energy without regard to the timing of that generation or the ancillary services (such as spinning reserve, flexibility, and energy storage) that a power plant may provide.

But CSP is already commercial and offers many of those ancillary services—in particular, it is subject to fewer short-term fluctuations in output (due to thermal mass) and can offer the type of flexible, responsive dispatchability with high ramp rates (either up or down) to respond to the needs of a grid with high levels of intermittent, non-dispatchable generation (such as wind or, ironically, PV solar). The value of CSP therefore generally increases with higher levels of penetration by wind or PV solar. CSP therefore plays a prominent role in NREL’s RE Futures study and some of the clean energy pathways, because the ancillary services that CSP provides are important for reliable grid operation.

There are two primary CSP technologies today: (1) parabolic troughs, which concentrate the solar insolation onto horizontal tubes that absorb the energy and transfer it to a heat transfer medium, and (2) power towers, which focus multiple mirrors to reflect the solar insolation onto a receiver that concentrates the energy for transfer to a heat transfer medium. In both cases, the heat transfer medium is then used to generate electricity through a standard boiler and generator13. Parabolic trough CSP has been deployed since the 1980s, while power tower technology is being commercialized now in some of the largest CSP power plants14. In both cases, CSP technology requires both economies of manufacturing scale (e.g., through learning as mass production scales up) and economies of unit scale (e.g., larger plants spread fixed costs over more production, and thus reduce the cost of electricity generated by each power plant).

Cost of Concentrating Solar Power

Figure A-2-9 compares the PATHWAYS capital cost projections for solar CSP and the SunShot Vision capital cost goals. PATHWAYS assumes that costs are $6.7/W in 2015 for solar thermal plants with storage, decreasing by more than half to $3.2/W by 2050. It assumes that costs are $6.1/W in 2015 for solar thermal without energy storage, decreasing to $2.9/kW by 2050.

Figure A-2-9. CSP Capital Cost Projection

CSP Capital Cost Projection

The SunShot Vision study reported that the oil-HTF trough concentrating solar power (CSP) technology cost $7.42/W and the salt-tower CSP cost $5.6/W (in $2012). The SunShot goal is to produce a combined cycle/tower plant that can be installed for $3.56/W by 2020.

As with PV, the PATHWAYS cost trajectory is as aggressive as the SunShot goals, but the timeline isn’t. PATHWAYS assumes that CSP with storage costs around $6.7/W in 2015, and will drop to $3.194/W by 2030.

EIA assumes that CSP (central tower) costs cost more than $4/W for installations in 2017 and drop by a minimum of 10% by 2035. Those costs don’t necessarily include storage so they were not included in the comparison chart.

NREL RE Futures shows that CSP is important for system-wide flexibility, but CSP potential is limited to the desert Southwest in the NREL RE Futures study, unlike the ubiquitous PV, which can utilize indirect solar insolation, which is available nationwide. High-reliability operation of a high-penetration, renewables-dominated grid requires the capacity, reserve, ramping, and load-following features of CSP technology or other technologies that can offer those ancillary services. And geographically linking more concentrated generation to the rest of the grid requires significant investments in transmission (just as low-cost wind from the Great Plains requires similar transmission investments to reduce the total system costs of clean energy economy electricity). Therefore, successful deployment of CSP will depend on coordinated transmission investment.

Perhaps more problematic, however, is the risk that current policies will continue to favor technologies (such as wind and PV solar) that have a lower levelized cost of energy (LCOE) but do not offer the same type of value through ancillary services as does CSP solar. This problem applies to nuclear, CCS, and other renewable technologies, too. Policies must therefore address the long-term value of a full portfolio of clean energy technologies to minimize total costs. Wind and PV solar will otherwise outcompete CSP solar in the short term but cut short the promising technologies that we will need in the long term to achieve a clean energy economy. This is an illustration of the path-dependent nature of the transition and the risk of dead-end technology choices and investments that could lead us to a cul-de-sac that increases costs from 2030-2050. The technical analysis assumes that such implementation challenges (which are discussed in more detail in Appendix A-3) are overcome through policies and market design for long-term value.

Geothermal Power

This section focuses on the cost and performance of geothermal energy.

Geothermal power utilizes geologic heat sources to produce electricity through either direct pressure on a turbine (which generates some problems due to the scaling associated with the geothermal resource) or by transferring the geothermal heat to another medium to generate steam that turns a turbine and a generator.

The Pathways study assumes that geothermal electric power generating plants cost $5,465/kW. That cost is projected in the study to stay the same over time.

According to the EIA, geothermal costs $6,243/kW for Dual Flash technology and $4,362/kW for Binary technology today. The choice of technology depends on the state of the fluid and its temperature15.

In the REF study, the mid-range scenario does not show a reduction in hydrothermal capital costs over time. The most optimistic scenario projects a 17% decrease in capital costs by 2050.

Technology research is primarily focused on developing Enhanced Geothermal Systems, which would use artificially-created reservoirs injected underground where heat exists but where there is not enough fluid to transmit the heat. 

The U.S. has approximately 30% of the total global geothermal generating capacity, with more than 3 GW installed. Power has been generated at the Geysers in northern California since 1923, beginning with a 35 kW plant that was expanded to reach more than 2,000 MW of capacity in the late 1990s but that now has only 725 MW of capacity. The declines were reportedly due to overexploitation of the geothermal resource and, according to some analysts, the changing institutional environment and economic incentives for geothermal operation associated with electricity deregulation.

Most of the operating geothermal capacity and potential is located in the seismically active western U.S., including sites under active exploration in recent years in the volcanic Cascade Range and the Salton Sea Known Geothermal Resource Area (KGRA) in California’s Imperial Valley. Geothermal is therefore more concentrated than wind or solar. Iceland meets just over one-fourth of its total electricity demand and nearly 90% of its heating demand through reliance on geothermal sources due to its unusual location on a continental rift.

The RE Futures study reported 6.4 GWe of identified hydrothermal sites and another 30 GWe of unidentified sites.

Geothermal power offers one primary advantage over wind or solar (either PV or CSP). It produces a steady output of power, so it functions much like a baseload coal or nuclear plant. Geothermal does not generally have the dispatchability benefits of CSP solar or hydropower and its output does not match peak load as well as solar (PV or CSP), and it is also generally more expensive than wind on a per MWh basis. However, geothermal output would match net load much better than either wind or solar, as those technologies increase their share of overall generation. It also uses transmission capacity more efficiently than either wind or solar. Finally, the inclusion of geothermal baseload power can push lower-marginal-cost resources to the margin on the supply curve—which can lower total system costs significantly16.

Hydropower

This section focuses on the cost and performance of hydropower.

Hydropower is one of the oldest and most ubiquitous renewable energy sources. Indeed, it is the leading renewable generating source globally. It accounts for about half of current U.S. renewable resource electricity generation, but its prospects are uncertain in a changing climate: Alterations in the hydrological regime are likely to decrease hydropower reliability, increase the variability of its output on a year-to-year basis, and therefore reduce its capacity value. Overall impacts on energy production will depend on whether or not storage capacity can accommodate increased variability in flows (conceivably, average annual energy could increase if storage capacity were increased to capture more extreme high-flow events for use at another time). However, environmental constraints on hydropower expansion are also likely to increase as climate change puts greater pressure on hydrologically-dependent species and water users.

There are three primary types of hydropower facilities: (1) run-of-river, which does not store any of the water for later use; (2) reservoir, where stored water can be released to turn turbines either at a dam or downstream after being conveyed to a point where the head of vertical displacement is greater; or (3) pumped storage, where the stored water can be pumped uphill during low-cost periods in order to make the water available during high-demand peak periods or to allow rapid ramping to respond to fluctuations in net load.

PATHWAYS assumes that large hydropower electric power generating plants cost $2754/kW with no change over time. It projects that smaller, run-of-river hydro facilities cost $6523/kW, which decreases gradually to $5344 by 2050. EIA assumes that large hydro costs $2,936.

Hydropower plants with storage are especially adept at responding to rapid fluctuations in electricity supply and demand, so their value will increase in a clean energy economy where greater flexibility is needed to integrate large amounts of renewables into the grid. Once again, however, that long-term value of hydropower is not reflected in today’s markets or policies, so there is a risk that we will fail to invest adequately in hydropower to increase system flexibility. This is another example where the clean energy economy of 2050 could be constrained or made more expensive by a failure to invest in flexibility over the next decades.

Hydropower is not projected to grow significantly in this analysis, but it will play a critical role in balancing the grid in all four of the pathways. Due to environmental constraints, future hydropower expansion is most likely to occur at existing dams or on canals and other water distribution facilities. Low-head hydro on canals could also prove important in some areas, where irrigation is extensive and elevation gradients make such investments economic. Run-of-river hydropower projects may also be economic if environmental constraints can be overcome, but such projects will also face greater uncertainty about hydrology and reliability.

Pumped storage is another way to increase flexibility, and it is the dominant storage technology today. Its benefits and how to value those benefits relative to their costs are discussed further below.

Balancing/Storage

This section focuses on the cost and performance of energy storage.

Energy storage is a critical tool for flexibility. It can quickly feed electricity into the grid to meet peaks or ramping needs, and can also manage overproduction by storing energy. One key question, therefore, is whether we have technologies that can cost-effectively meet the need for energy storage.

We can store energy by pumping water uphill, compressing air, storing heat, charging batteries (large utility-scale batteries as well as small building or electric vehicle batteries), or splitting water to make hydrogen and other fuels through electrolysis. Each option is already commercial or near-commercial. Each has unique advantages and disadvantages.

Batteries are highly efficient. They provide almost instant power, and enable transportation to become an integral part of the grid (through plugged-in electric vehicles). They are also relatively expensive, although prices are dropping rapidly.

The cost of batteries has been declining by about 8% per year in the period from 2007 to 2014 (see Figure A-2-10)17, and that trend is expected to continue with the completion of such facilities as Tesla’s large-scale battery manufacturing plant in Nevada in 2016 or late 201718. The dominant battery chemistry has been lithium ion in recent years, but other chemistries may become important soon19. Batteries were a relatively sleepy area of technology for decades, but once the electronic industry focused on better ways to power mobile devices, both the level of investment and the rate of technological improvement increased rapidly.

Figure A-2-10. Cost of Li-ion battery packs in BEV

Cost of Li-ion battery packs in BEV

Note: Data are form multiple types of sources and trace both reported cost for the industry and costs for market-leading manufactures. If costs reach US$150 per kWh this is commonly considered as the point of commercialization of BEV.

Source: Nykvist, Bjorn, and Mans Nilsson. 2015. “Rapidly falling costs of battery packs for electric vehicles.” Nature Clim. Change. vol. 5, no. 4. 04//print. pp. 329-332. [http://dx.doi.org/10.1038/nclimate2564]

Pumped storage is much cheaper than batteries (especially when added to existing hydro facilities) but only gets back three-fourths of the power it uses for pumping. As a result, it makes the most economic sense when cheap electricity can be used for pumping. Intermittent, zero-marginal-cost generators such as wind or nuclear may sometimes make the pumping energy cost essentially zero if that electricity otherwise would have gone to waste.

Electrolysis to produce synthetic natural gas and liquid fuels is another way to store excess electricity production from zero-marginal-cost generators (including both renewable and nuclear sources, which need to operate more steadily) for use outside the electricity sector.

Many of these applications are already cost-effective, explaining why storage capacity is already growing rapidly in the U.S. and around the world. It’s also clear that policies, such as California’s mandate for 1.325 GW of storage on the grid by 2020, can be very effective at accelerating the rate of growth, spurring more innovation, and driving down costs. That, in turn, will make storage even more cost-effective20. Based on these trends, this report concludes that the current and expected future energy storage technologies in PATHWAYS will indeed be able to meet the needs of a clean energy economy—and represent a major business opportunity. Lowering the cost of storage and ramping up its production is a key element of the clean energy economy, because greater flexibility is required for a reliable grid.

The IEA storage roadmap contains a good discussion of various types of energy storage and their state of technological maturity21. It also contains a discussion of the key breakthroughs that should be targeted to meet cost reduction goals. Figure A-2-11, reproduced from the IEA report, presents a relative comparison of the costs and risks associated with current technologies.

Figure A-2-11. Maturity of energy storage technologies

Maturity of energy storage technologies

Carbon Capture and Sequestration (CCS)

This section focuses on the cost and performance of carbon capture and sequestration (CCS).

The existing electric generation system was built on fossil fuels. Coal and natural gas facilities continue to be part of the bedrock of system reliability and operation. The economic dislocation that would come from completely abandoning those facilities—causing lost jobs, lower tax base, and stranded capital—is therefore an important concern for business, labor, and policy-makers. Finding a way to continue to burn coal and natural gas without increasing climate risks remains a priority for research and investment for the public and private sectors. Techniques to capture the carbon emitted by fossil fuel combustion and then sequester that carbon underground (where it will not contribute to climate change) are broadly called Carbon Capture and Sequestration (CCS). There could be a huge market for commercially viable CCS technologies if they can deliver emissions reductions cost-effectively. We therefore evaluated the role that CCS can play if it can overcome some key obstacles. PATHWAYS treats CCS as a near-commercial technology (at a 90% capture rate). CCS plays an important role in the High CCS pathway and a smaller role in the Mixed Resources pathway.

However, CCS faces two major hurdles before it can become a major source of low-carbon electricity. The first is the high cost of CCS. Adding a pilot carbon capture system to just one power plant—American Electric Power’s Mountaineer Plant in West Virginia—cost $668 million22. Running the system then cut the power plant’s output by an estimated 20%, increasing the cost per MWh. Transporting and injecting the CO2 into the ground for storage would bring even more expense23. The Kemper CCS plant in Mississippi, under construction by Southern Company and Mississippi Power, is now $4 billion over its initial budget of $2.4 billion24. However, some argue that the Kemper plant’s problems are not primarily due to or inherent in CCS technology25.

Proponents argue that the price tag likely would drop with large-scale deployment, and that some of the captured CO2 can be sold for injection into oil fields for enhanced oil recovery (EOR) or other uses. In fact, all of the commercial power plant CCS projects in the world inject the captured carbon for EOR26. If CCS came into widespread use, however, the amount of captured CO2 would be orders of magnitude higher than the volumes for potential EOR markets.

The second hurdle involves the safe and permanent sequestration of all the captured CO2. There are uncertainties regarding how long CO2 injected into geological formations will stay there. There are also difficult policy questions surrounding the choice of locations for sequestration, and thorny legal issues about who has responsibility and liability if leakage—or actual damage—occurs.

For these reasons, our modeling categorizes CCS as a near-commercial technology and it phases in slowly over time in two of our clean energy pathways, assuming that it becomes a fully commercial technology in response to further RD&D and a supportive policy framework. One must keep in mind, however, that it is likely to remain a low-carbon, not a zero-carbon, means of producing electricity (or providing industrial heat). The mining of coal results in substantial methane emissions, and methane leaks occur when natural gas is produced, transported, and distributed. Methane is especially important in the near term, because it is 40-80 times more potent than CO2 as a greenhouse gas over a 20-40 year period. Even a CCS technology with a 100 percent capture rate could still have significant GHG emissions on a lifecycle basis27.

Further RD&D and a supportive policy framework are prudent, regardless of the role it ends up playing in the power sector. CCS is the only technology that can achieve deep emission reductions in key industry sectors (e.g., cement, chemicals, iron and steel). CCS likely has key roles to play in the deeper decarbonization needed at the U.S. and global levels over the course of this century.

Regarding cost, PATHWAYS assumes that a coal steam plant with CCS coming online in 2020 would have a levelized capital cost of about $6000 per kilowatt (2014$). As the technology matured, the capital cost would decrease about 6% per decade from 2020-2050, reaching about $5000 per kilowatt in 2050. A coal IGCC plant would follow a similar trajectory from roughly $7300 per kilowatt in 2020 to roughly $6000 in 2050. A gas combined cycle plant with CCS would have a levelized capital cost of about $2000 per kilowatt in 2020. The capital cost would decrease about 7% per decade from 2020-2050, reaching about $1600 per kilowatt in 2050. These projections are consistent with the cost projections in AEO 2015.

Nuclear Power

This section focuses on the cost and performance of nuclear power.

Nuclear power presents a complex and contentious set of issues in assessing clean energy pathways. Proponents of nuclear power argue that this zero-carbon electricity source is essential to achieving large reductions in GHG emissions. Some opponents support a freeze and eventual phase-out of nuclear power, arguing that it is uneconomic and has unresolved safety issues. Nuclear power has been a fully commercial technology for decades, and currently generates about one-fifth of total U.S. electricity, and more than 60% of zero-carbon power. In recent years, the average capacity factors of nuclear plants have exceeded 90%, providing highly reliable baseload power.

The vast majority of nuclear plants in operation in the U.S. are “Generation II” reactors, which followed a first generation of prototype designs, and came on line prior to 200028. More than a dozen Generation III nuclear plants are in operation globally, incorporating evolutionary improvements in design from Generation II plants. PATHWAYS considers Generation III a commercial technology (but does not assume availability of Generation IV designs). The High Nuclear and Mixed Resources pathways assume significant expansion of nuclear power, while the High Renewables and High CCS pathways assume little change beyond the levels in the High Carbon Reference Case.

PATHWAYS assumes that a Generation III nuclear plant coming online in 2020 would have an installed capital cost of about $5600 per kilowatt (2014$). As the technology matured, the capital cost would decrease about 7% per decade from 2020-2050, reaching about $4500 per kilowatt in 2050. These projections are consistent with the cost projections in AEO 2015.

A large expansion of nuclear power in the U.S. would face several major hurdles.

First, the U.S.’s existing fleet of 61 nuclear power plants is aging. The oldest operating reactors in the U.S. began commercial service in 1969, while the last unit that was part of the construction boom of the 1970s and 1980s entered service in 199629. The Nuclear Regulatory Commission (NRC) licenses plants to operate for 40 years with possible 20-year extensions. So by 2050, most of the existing nuclear fleet will no longer be operating. In fact, several nuclear plants that have received license extensions have recently shut down—or announced plans to shut down—in part due to unfavorable economics in organized electricity markets. In part, this reflects the mismatch between policies and market design that also constrains development of CSP and geothermal, as noted above. Current wholesale market designs generally lead to low energy prices, largely driven by low natural gas prices and renewable sources bidding at near-zero or even below-zero levels. Capacity prices are generally low due to oversupply, and there is no mechanism in place to remunerate nuclear plants for their zero rate of emissions. All these factors make it difficult for nuclear plants to recover their fixed costs in the organized markets.

The increasing value of flexibility with greater variation in net load also works against nuclear power. Exelon (the largest nuclear generator in the country) recently announced plans to close its Clinton, Illinois and Quad Cities plants but absent a solution that would compensate the facilities for their capacity30. Other Exelon plants have also failed to clear the PJM capacity auction, raising similar risks of closure31.

In addition to those challenges, existing nuclear plants also face costly upgrades for seismic retrofitting or to meet new water quality standards since they were first licensed. In California, PG&E recently determined that it was less expensive to retire the Diablo Canyon Nuclear Power Plant and replace its output with energy efficiency and renewables than to make the seismic and water quality upgrades necessary to relicense it and extend its useful life32. So most of the low carbon electricity from the existing nuclear fleet will have to be replaced by other sources by 2050 and much of it well before then.

Second, the new nuclear plants under construction in the U.S. are over budget and behind schedule, in spite of new reactor designs, better construction practices, and streamlined licensing procedures33. The industry argues that these issues are being solved, but that assertion remains to be proven.

If new reactors can be built on time and on budget, the contribution of nuclear to reducing emissions could be significant. Without improved construction cost performance, however, rapidly expanding nuclear power in the U.S. will be difficult.

The economics of nuclear power remain challenging, not just in the U.S. but internationally as well. The European Pressurized Reactor (EPR) design was supposed to represent a new, lower-cost approach to nuclear power. But new projects using the design in Olkiluoto, Finland, and Flamanville, France, have fallen far behind schedule and are costing much more than projected. The price tag of the Finnish plant, for example, has already more than doubled the original €3 billion estimate, and the plant won’t enter operations until 2018 at the earliest: nine years behind schedule.

Finally, issues of both nuclear fuel cycle security and long-term storage of nuclear waste remain unresolved. Nearly thirty years of work by the U.S. DOE to create a waste repository in Nevada’s Yucca Mountain ended in a political stalemate. The industry has been left with no options other than continuing to store waste on site at existing nuclear power plants. The failure to find a long-term solution has strengthened the political opposition to licensing new nuclear power plants or renewing the licenses of existing facilities.

Efficiency

This section focuses on the cost and performance of being energy efficient.

End-use efficiency in buildings and industry

Energy efficiency is often called “the first fuel” because it is the cheapest and fastest way to meet energy service demands at lower cost. There are many technologies and potential technology advancements that are expected to make the nation’s use of energy more efficient. In the residential and commercial building sector, key efficiency technologies will be found in space heating and cooling, lighting, water heating, appliance efficiency improvement, and others. In addition to those technology improvements, efficiency gains are projected in industrial energy use through process optimization. There are also large gains to be made in the transportation sector (discussed below) and in the electric sector through reduced losses in transmission and distribution. Improvements in energy use could come as a result of a combination of technology innovation, design improvement, and change in behavior. Below we take a closer look at PATHWAYS assumptions for lighting and water heating costs.

In the lighting sector, PATHWAYS assumes that LED light bulbs will be roughly the same cost for the same illumination as today’s incandescent or CFL bulbs by 2030 (see Fig A-2-12).

Figure A-2-12. Projected costs for light bulbs (PATHWAYS)

Projected costs for light bulbs (PATHWAYS)

Source: Evolved Energy Research

These cost assumptions are very similar to the cost assumptions used by the EIA in the 2014 Annual Energy Outlook (see Figure A-2-13)34.

Figure A-2-13. Projected costs for light bulbs (AEO 2014)

Projected costs for light bulbs (AEO 2014)

Source: U.S. Energy Information Administration, Annual Energy Outlook 2014 Early Release.

These cost reductions are expected to come as a result of federal and state incentives that have increased the market for LED and compact fluorescent lighting, as well as from innovations in LED materials, design, and manufacturing (Figure A-2-14).

Figure A-2-14. LED Package Price/Efficacy Projections

LED Package Price/Efficacy Projections

Source: Department of Energy Energy Efficiency and Renewable Energy Building Technologies Office. “Solid-State Lighting R&D Plan.” June 2016. Accessed September 2016. http://energy.gov/sites/prod/files/2016/06/f32/ssl_rd-plan_%20jun2016_0.pdf.

For residential water heating (a very mature technology), PATHWAYS is projecting little or no cost reductions from today’s technology across the range of electric and gas options (see Figure A-2-15).

Figure A-2-15. PATHWAYS Assumptions For Cost of Residential Water Heating

PATHWAYS Assumptions For Cost of Residential Water Heating

Alternative Transportation Technologies

This section focuses on the cost and performance of alternative transportation technologies.

The carbon intensity in the transportation sector is dramatically reduced in PATHWAYS by improving fuel efficiency, switching to low- or no-carbon liquid fuels such as natural gas and hydrogen, and switching to electric drivetrains that are powered by a largely de-carbonized electricity system.

In our clean energy pathways, the light-duty vehicle (LDVs) stock turns over almost completely from fossil fuel-powered internal combustion engines (ICE) to a mix of Electric Vehicles (EVs), plug-in hybrid electric vehicles (PHEVs), and hydrogen fuel cell vehicles (HFCVs). In the High Renewables and High CCS cases, EVs and PHEVs dominate the vehicle fleet. In the High Nuclear case, HFCVs and EVs dominate. The Mixed Resources case has a roughly equal blend of EVs, PHEVs, and HFCVs by 2050.

Figure A-2-16 shows the average cost assumptions for light-duty auto costs in the PATHWAYS model. In 2020, EVs, PHEVs and HCFVs command a price premium of $5000-$10,000 more than the average conventional LDV. This premium narrows over time as technologies mature and economies of scale in production are reached. By 2050, EVs and HCFVs would cost essentially the same as conventional LDVs. PHEVs would still cost about $5000 more. These projections are consistent with the cost projections in AEO 2015.

Figure A-2-16. PATHWAYS LDV Cost Assumptions

PATHWAYS LDV Cost Assumptions

Source: Evolved Energy Research

In the High Nuclear and High CCS cases where biomass used to make a liquid diesel fuel, ICE diesel vehicles remain the main form of heavy-duty transport. If biomass is used to make gaseous fuels, liquefied pipeline gas or hydrogen fuels will power heavy-duty vehicles instead.

For the remaining forms of transportation, including aviation, freight rail, passenger rail, medium-duty trucking, buses, and military use, a combination of biofuels (aviation), electrification, hybridization, and fuel cells (freight rail, passenger rail, medium-duty trucking, buses) would be employed to reduce emissions. These changes in technology are accompanied by energy efficiency improvements, resulting in around 35% reductions in final energy demand relative to the Reference Case.

Our PATHWAYS modeling did not rely on assumptions of changes in driving habits or of dramatically new vehicle materials and design. Some other studies we reviewed explore such assumptions, along with changes in urban design that could reduce demand for some transportation modes.

Alternative Fuel Vehicles

According to the EIA, 20% of light-duty vehicles are “alternative fuel vehicles,” but three-fourths of these vehicles are “flex-fuel” cars and light-duty trucks, most of which run nearly all the time on normal gasoline blends. Hybrid Electric Vehicles currently make up 2% of light-duty cars and trucks on the road. The barriers to wider penetration are higher up-front vehicle costs, as well as non-cost barriers such as lack of charging infrastructure, long battery charge times, limited range, and battery performance.

Electric Vehicles (EV) and Plug-in Hybrid Electric Vehicles (PHEV)

Customers in the most electric vehicle-friendly market,California, can choose from more than 20 models by 16 makers, but only some of these are available throughout the U.S. Costs are declining rapidly, as batteries improve and electric drive train production scales up (see section above on batteries in Balancing/Storage).

Most of today’s battery only electric vehicles currently have a range of less than 100 miles. Nissan, GM, and Tesla are expected to release high-range, affordable cars in the next few years.

It is clear that policies such as access to car pool lanes, rebates and tax credits for vehicles, and subsidies for charging stations are helping grow the market for EVs.

Fuel Cell Vehicles

Fuel cell vehicles face three major challenges: cost, reliability, and the need to build out the fuel supply network35. Research studies have demonstrated the potential for cost reductions and reliability improvements, but there has been little evidence of improvements in production devices large enough for FCVs to compete with electric vehicles. That may change as Toyota and other major manufacturers turn their attention to fuel cells, but mass adoption is also hostage to the lack of a fuel distribution network for hydrogen, which will need to be built from scratch in most places. This is why fuel cell vehicles are most likely to see adoption first as fleet vehicles rather than as individual LDVs.

Charging/fuel infrastructure

One of the biggest challenges for transforming the transportation sector is building infrastructure to fuel or power vehicles. The fossil fuel infrastructure has been developed over the past century so that gasoline, diesel, and jet fuel are widely available and inexpensive.

For electric vehicles, companies like Tesla are building fast charging networks, because they know range is a critical issue for electric car owners who want to take long trips, even with a battery pack that delivers more than 200 miles of driving range. At the household level, it’s likely that 220 volt connections in garages or in front of houses will become standard equipment, because double the voltage means twice the charging speed.

The infrastructure challenge is bigger for fuel cell vehicles, because building a hydrogen fueling network is much more expensive, and it’s unlikely such a network will be available at the household level anytime soon (unlike electricity, where anybody can plug in his/her car at home). Fuel cell vehicles are most likely to become common in fleet vehicles long before they are widely used in households.

Conclusion

Comparing the PATHWAYS projections for the cost and performance of various technologies to projections made by recent U.S. government studies, we conclude that PATHWAYS assumptions are moderate-to-conservative and would not require extraordinary R&D advances to realize the energy costs described in Appendix 1. The future technology availability and economic performance assumptions used in our modeling of clean energy pathways are reasonable. The next appendix examines some implementation challenges involved with the high levels of deployment of new technologies described in the various pathways.

View footnotes

  1. Wiser, R., Bolinger, M., et al. 2015.“Wind Technologies Market Report,” U.S. Department of Energy, Energy Efficiency & Renewable Energy, available at http://energy.gov/sites/prod/files/2016/08/f33/2015-Wind-Technologies-Market-Report-08162016.pdf.
  2. Smith, A., Stehly, T., Musial, W., et al. 2015. “Offshore Wind Technologies Market Report,” National Renewable Energy Laboratory, September, available at http://energy.gov/sites/prod/files/2015/09/f26/2014-2015-offshore-wind-technologies-market-report-FINAL_1.pdf.
  3. U.S. Department of Energy, “Wind Vision,” March 2015, available at http://www.energy.gov/sites/prod/files/wv_appendix_final.pdf.
  4. U.S. Department of Energy. 2015. “Assumptions to AEO 2015, Electricity Market Module,” Energy Information Administration, September, available at http://www.eia.gov/forecasts/aeo/assumptions/pdf/electricity.pdf.
  5. For a thorough discussion of potential cost improvements, see Chapter 4: The Wind Vision Roadmap: A Pathway Forward. U.S. Department of Energy, “Wind Vision,” March 2015, available at http://energy.gov/sites/prod/files/2015/03/f20/wv_chapter4_the_wind_vision_roadmap.pdf.
  6. Barbose, G., Darghouth, N., et al. 2016. “Tracking the Sun IX,” Lawrence Berkeley National Laboratory, August, available at https://emp.lbl.gov/sites/all/files/tracking_the_sun_ix_report.pdf.
  7. Bolinger, M., and J. Seel. 2016. “Utility-Scale Solar 2015: An Empirical Analysis of Project Cost, Performance, and Pricing Trends in the United States,” (Berkeley, CA: Lawrence Berkeley National Laboratory. LBNL-1006037), August, available at https://emp.lbl.gov/sites/all/files/lbnl-1006037_report.pdf .
  8. U.S. Department of Energy, “SunShot Vision Study,” February 2012, available at http://energy.gov/sites/prod/files/2014/01/f7/47927.pdf.
  9. Woodhouse, M., R. Jones-Albertus, et al. 2016. , “On the Path to SunShot: The Role of Advancements in Solar Photovoltaic Efficiency, Reliability, and Costs,” NREL/TP-6A20-65872. Golden, CO: National Renewable Energy Laboratory,, available at http://www.nrel.gov/docs/fy16osti/65872.pdf .
  10. Hand, M.M., Baldwin, S., DeMeo, E., Reilly, J.M., Mai, T., Arent, D., Porro, G., Meshek, M., Sandor, D. Eds., 2012.mRenewable Electricity Futures Study. NREL/TP-6A20-52409. Golden, CO: National Renewable Energy Laboratory,, available at http://www.nrel.gov/analysis/re_futures/.
  11. Federal Ministry of Economic Affairs and Energy, “Facts and Figures,” available at http://www.bmwi.de/EN/Topics/Energy/Electricity-Market-of-the-Future/facts-and-figures.html (last accessed August 2016).
  12. Note that the PPAs have embedded the 30% tax credit and don’t include backup costs, so the full societal costs would be higher. Of course, the PPA prices also don’t include environmental externalities.
  13. This is also how most coal, oil, and nuclear generators produce power. Natural gas turbines spin the generator with exhaust gases and do not go through the intermediate step of a steam turbine, while combined-cycle plants (often fueled by natural gas) utilize both steps.
  14. Unlike parabolic trough CSP, however, power tower CSP has encountered siting and permitting difficulties due to the impact of the solar flux on bird mortality and morbidity.
  15. U.S. Department of Energy, “Electricity Generation,” available at http://energy.gov/eere/geothermal/electricity-generation (last accessed August 2016).
  16. Caldwell, J.R., and L. Anthony. 2016. “The Value of Salton Sea Geothermal Development in California’s Carbon Constrained Future,” Center for Energy Efficiency and Renewable Technologies, March, available at http://docketpublic.energy.ca.gov/PublicDocuments/15-RETI-02/TN211028_20160413T134844_Liz_Anthony_Comments_The_Value_of_Salton_Sea_Geothermal_Develop.pdf.
  17. Nykvist, B., and M. Nilsson. 2015., “Rapidly falling costs of battery packs for electric vehicles,” Nature Clim. Change. vol. 5, no. 4. 04//print. pp. 329-332, available at http://www.technologyreview.com/news/536336/inexpensive-electric-cars-may-arrive-sooner-than-you-think.
  18. Shahan, Z. 2015. “Tesla Gigafactory Now On Schedule for 2016, not 2017,” Solar Love, February 15, available at http://solarlove.org/tesla-gigafactory-now-schedule-2016-not-2017/ .
  19. Bullis, K. 2015. “Old Battery Type Gets an Energy Boost”, MIT Technology Review. February 19, , available at http://www.technologyreview.com/news/535251/old-battery-type-gets-an-energy-boost/. Bullis, K. 2014. “A Battery With Liquid Electrodes Can Be Recharged Or Filled,” MIT Technology Review. February 17, available at http://www.technologyreview.com/news/524781/a-battery-with-liquid-electrodes-can-be-recharged-or-refilled/. Hiler, K. 2013. “What’s Next in Electric-Car-Battery Tech,” Popular Mechanic, December 18, available at http://www.popularmechanics.com/cars/hybrid-electric/a9804/whats-next-in-electric-car-battery-tech-16280750/.
  20. Nykvist, B., and M. Nilsson. 2015. “Rapidly falling costs of battery packs for electric vehicles.” Nature Climate Change. vol. 5, no. 4. 04//print. pp. 329-332, available at http://dx.doi.org/10.1038/nclimate2564.
  21. International Energy Agency. 2014., “Technology Roadmap, Energy Storage,” available at: https://www.iea.org/publications/freepublications/publication/TechnologyRoadmapEnergystorage.pdf.
  22. “In late 2009, the U.S. DOE announced funding of $334 million to advance the project to a commercial scale to capture and sequester 235 MW carbon dioxide emissions. The DOE funding is estimated to be approximately half of the total project cost.” From West Virginia Public Service Commission Management Summary Report 2009: http://www.psc.state.wv.us/Mgmt_Sum/MSR2009_Report.pdf
  23. In part because of the high costs, the planned second phase of the Mountaineer CCS demonstration project was canceled in 2015.
  24. Urbina, I. 2016. “Piles of Dirty Secrets behind Model ‘Clean Coal’ Project,” New York Times, July 5, available at http://www.nytimes.com/2016/07/05/science/kemper-coal-mississippi.html?hp&action=click&pgtype=Homepage&clickSource=story-heading&module=second-column-region&region=top-news&WT.nav=top-news&_r=1.
  25. Plumer, B. 2016. “A flagship ‘clean coal’ plant is a flailing mess. Does that mean the technology is doomed?” Vox Energy & Environment, July 6, , available at http://www.vox.com/2016/7/5/12098504/kemper-ccs-problems-clean-coal.
  26. MIT, “CCS Project Database,” available at https://sequestration.mit.edu/tools/projects/index_eor.html (last accessed August, 2016).
  27. Use of biomass combustion with CCS holds promise, but serious questions remain regarding use of forest biomass or otherwise converting land to grow dedicated biomass crops and their effects on lifecycle GHG emissions.
  28. Koomey, J. G., and N. E. Hultman. 2007. “A reactor-level analysis of busbar costs for U.S. nuclear plants, 1970-2005.”  Energy Policy.  vol. 35, no. 11. November. pp. 5630-5642, available at http://dx.doi.org/10.1016/j.enpol.2007.06.005.
  29. Energy Information Administration, “Frequently Asked Questions website,” available at http://www.eia.gov/tools/faqs/faq.cfm?id=228&t=21 (last accessed July 2016). TVA’s Watts Bar unit 2 entered commercial operation in October 2016 and is the newest unit in the fleet. (http://www.nei.org/News-Media/Media-Room/News-Releases/TVA-s-Watts-Bar-Unit-2-Begins-Commercial-Operation). Four additional units are under construction and slated to enter service in 2019-2020.
  30. Bade, G. 2016. “Exelon to shut Clinton, Quad Cities nuclear plants after Illinois bill stalls,” Utility Dive, June 2, available at http://www.utilitydive.com/news/exelon-to-shut-clinton-quad-cities-nuclear-plants-after-illinois-bill-stal/420237/.
  31. Patel, S. 2016. “Two Exelon Nuclear Plants Fail to Clear PJM Auction,” Power, May 25, available at http://www.powermag.com/two-exelon-nuclear-plants-fail-to-clear-pjm-auction/.
  32. PG&E. 2016. “Joint Proposal of Pacific Gas and Electric Company, Friends of the Earth, Natural Resources Defense Council, Environment California, International Brotherhood of Electrical Workers Local 1245, Coalition of California Utility Employees and Alliance for Nuclear Responsibility to Retire Diablo Canyon Nuclear Power Plant at Expiration of the Current Operating Licenses and Replace It With a Portfolio of GHG Free Resources.” Available at https://www.pge.com/includes/docs/pdfs/safety/dcpp/JointProposal.pdf. PG&E also pointed to the expectation that it would only be able to run the plant at a lower capacity factor owing to the impact of policies that would limit the conditions under which it could be used, notably the passage of a state RPS of 50 percent.
  33. For example, Vogtle 3 and 4 in Georgia use the new AP1000 technology, which should in principle be faster and easier to construct than previous reactors. See: Georgia Power, “Vogtle 3 & 4 Project Overview,” available at http://www.georgiapower.com/about-energy/energy-sources/nuclear/overview.cshtml (last accessed August 2016). Unfortunately, the plants are over budget and much delayed from the original schedule. See: Taxpayers for Common Sense. 2014. “DOE Loan Guarantee Program: Vogtle Reactors 3&4,”available at http://www.taxpayer.net/library/article/doe-loan-guarantee-program-vogtle-reactors-34.
  34. Energy Information Administration website, “Today in Energy,” available at http://www.eia.gov/todayinenergy/detail.cfm?id=15471&src=email (last accessed July 2016).
  35. U.S. DRIVE. 2013. “Fuel Cell Technical Team Roadmap,” June, available at http://energy.gov/sites/prod/files/2014/02/f8/fctt_roadmap_june2013.pdf.

Share this post