

Executive Summary
Damages from storms, flooding, and heat waves are already costing local economies billions of dollars—we saw that firsthand in New York City with Hurricane Sandy. With the oceans rising and the climate changing, the Risky Business report details the costs of inaction in ways that are easy to understand in dollars and cents—and impossible to ignore.1
The U.S. faces significant and diverse economic risks from climate change. The signature effects of human-induced climate change—rising seas, increased damage from storm surge, more frequent bouts of extreme heat—all have specific, measurable impacts on our nation’s current assets and ongoing economic activity.
To date, there has been no comprehensive assessment of the economic risks our nation faces from the changing climate. Risky Business: The Economic Risks of Climate Change to the United States uses a standard risk-assessment approach to determine the range of potential consequences for each region of the U.S.—as well as for selected sectors of the economy—if we continue on our current path. The Risky Business research focused on the clearest and most economically significant of these risks: Damage to coastal property and infrastructure from rising sea levels and increased storm surge, climate-driven changes in agricultural production and energy demand, and the impact of higher temperatures on labor productivity and public health.
Our research combines peer-reviewed climate science projections through the year 2100 with empirically-derived estimates of the impact of projected changes in temperature, precipitation, sea levels, and storm activity on the U.S. economy. We analyze not only those outcomes most likely to occur, but also lower-probability high-cost climate futures. Unlike any other study to date, we also provide geographic granularity for the impacts we quantify, in some cases providing county-level results.
Our findings show that, if we continue on our current path, many regions of the U.S. face the prospect of serious economic effects from climate change. However, if we choose a different path—if we act aggressively to both adapt to the changing climate and to mitigate future impacts by reducing carbon emissions—we can significantly reduce our exposure to the worst economic risks from climate change, and also demonstrate global leadership on climate.
Short-term Climate Threats
The American economy is already beginning to feel the effects of climate change. These impacts will likely grow materially over the next 5 to 25 years and affect the future performance of today’s business and investment decisions in the following areas:
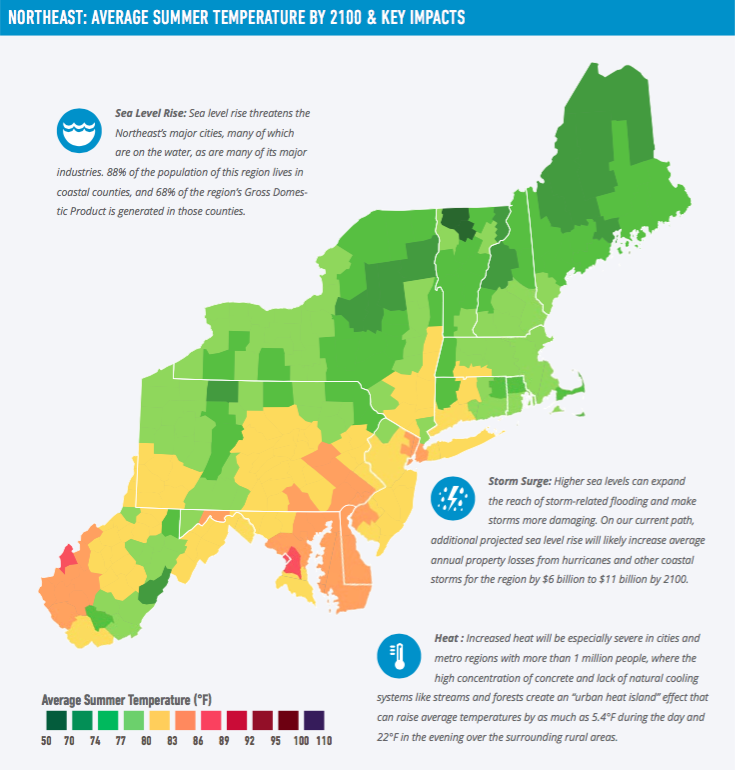
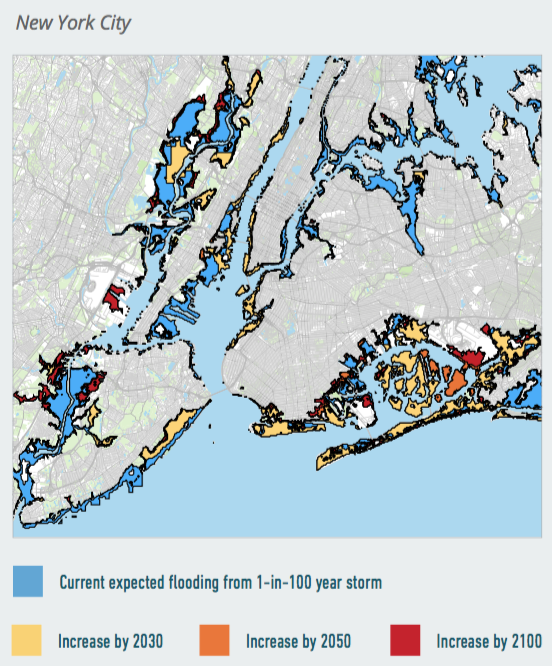
Coastal property and infrastructure. Within the next 15 years, higher sea levels combined with storm surge will likely increase the average annual cost of coastal storms along the Eastern Seaboard and the Gulf of Mexico by $2 billion to $3.5 billion. Adding in potential changes in hurricane activity, the likely increase in average annual losses grows to up to $7.3 billion, bringing the total annual price tag for hurricanes and other coastal storms to $35 billion.
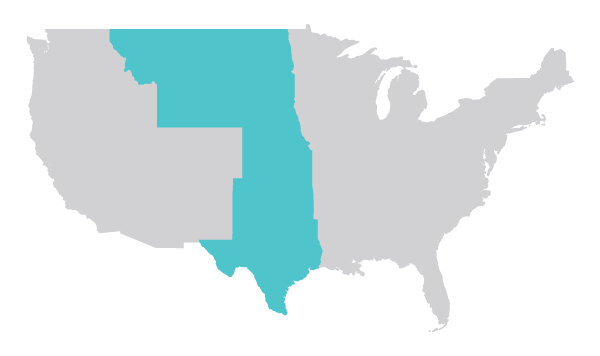
Agriculture. A defining characteristic of agriculture in the U.S. is its ability to adapt. But the adaptation challenge going forward for certain farmers in specific counties in the Midwest and South will be significant. Without adaptation, some Midwestern and Southern counties could see a decline in yields of more than 10% over the next 5 to 25 years should they continue to sow corn, wheat, soy and cotton, with a 1-in-20 chance of yield losses of these crops of more than 20%.
Energy. Greenhouse gas-driven changes in temperature will likely necessitate the construction of up to 95 gigawatts of new power generation capacity over the next 5 to 25 years—the equivalent of roughly 200 average coal or natural gas-fired power plants—costing residential and commercial ratepayers up to $12 billion per year.
Climate Change: Nature’s Interest-Only Loan
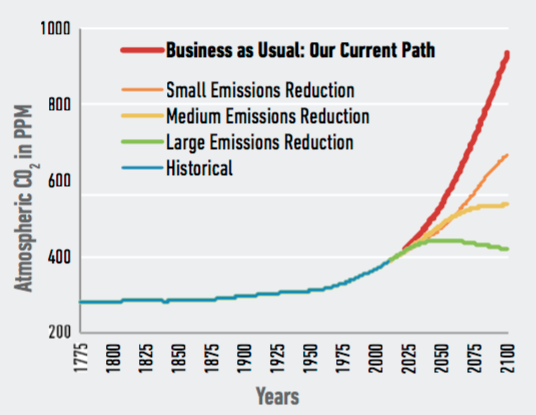
Our research focuses on climate impacts from today out to the year 2100, which may seem far off to many investors and policymakers. But climate impacts are unusual in that future risks are directly tied to present decisions. Carbon dioxide and other greenhouse gases can stay in the atmosphere for hundreds or even thousands of years. Higher concentrations of these gases create a “greenhouse effect” and lead to higher temperatures, higher sea levels, and shifts in global weather patterns. The effects are cumulative: By not acting to lower greenhouse gas emissions today, decision-makers put in place processes that increase overall risks tomorrow, and each year those decision-makers fail to act serves to broaden and deepen those risks. In some ways, climate change is like an interest-only loan we are putting on the backs of future generations: They will be stuck paying off the cumulative interest on the greenhouse gas emissions we’re putting into the atmosphere now, with no possibility of actually paying down that “emissions principal.”
Our key findings underscore the reality that if we stay on our current emissions path, our climate risks will multiply and accumulate as the decades tick by. These risks include:
- Large-scale losses of coastal property and infrastructure
- If we continue on our current path, by 2050 between $66 billion and $106 billion worth of existing coastal property will likely be below sea level nationwide, with $238 billion to $507 billion worth of property below sea level by 2100.
- There is a 1-in-20 chance—about the same chance as an American developing colon cancer; twice as likely as an American developing melanoma2—that by the end of this century, more than $701 billion worth of existing coastal property will be below mean sea levels, with more than $730 billion of additional property at risk during high tide. By the same measure of probability, average annual losses from hurricanes and other coastal storms along the Eastern Seaboard and the Gulf of Mexico will grow by more than $42 billion due to sea level rise alone. Potential changes in hurricane activity could raise this figure to $108 billion.
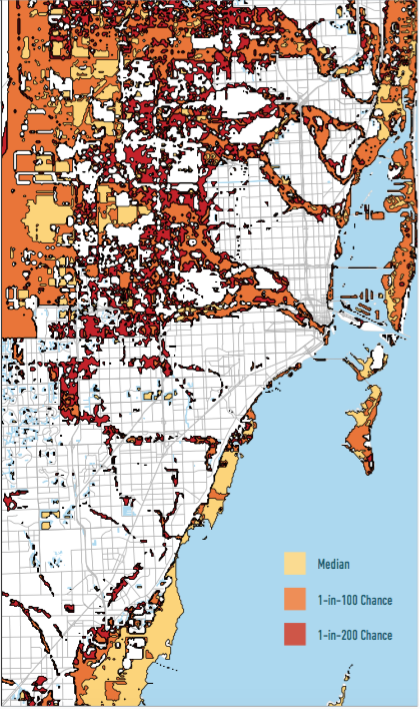
- Property losses from sea level rise are concentrated in specific regions of the U.S., especially on the Southeast and Atlantic coasts, where the rise is higher and the losses far greater than the national average.
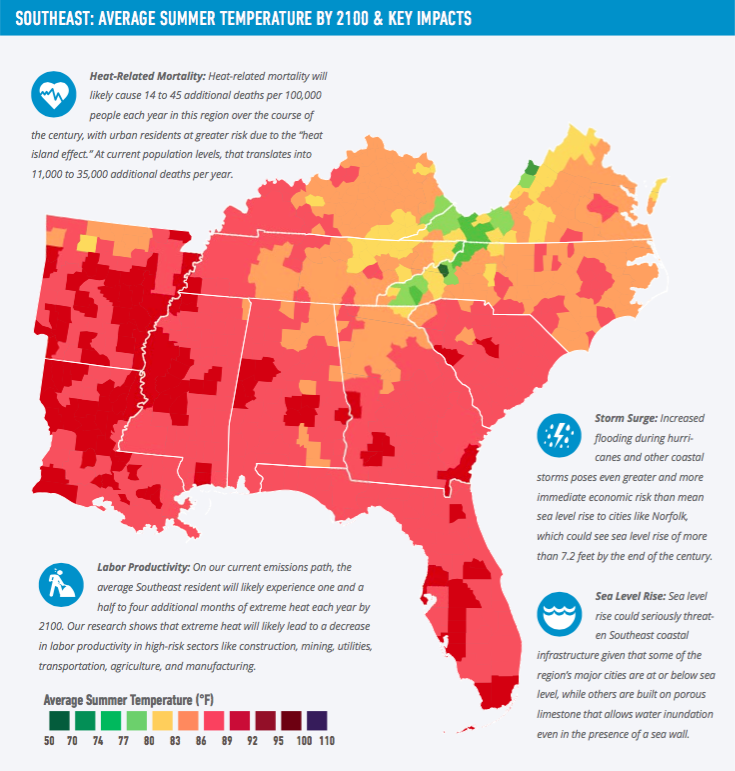
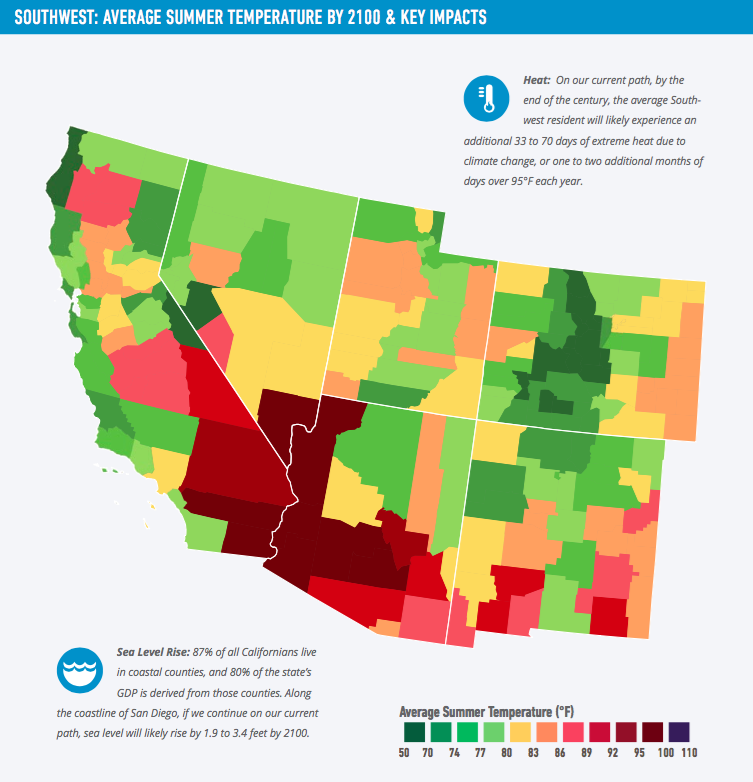
- Extreme heat across the nation—especially in the Southwest, Southeast, and Upper Midwest—threatening labor productivity, human health, and energy systems
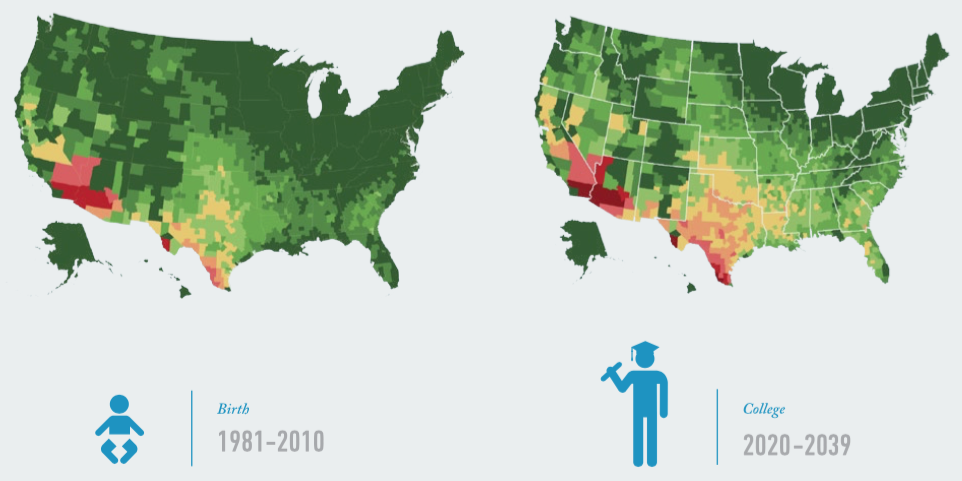
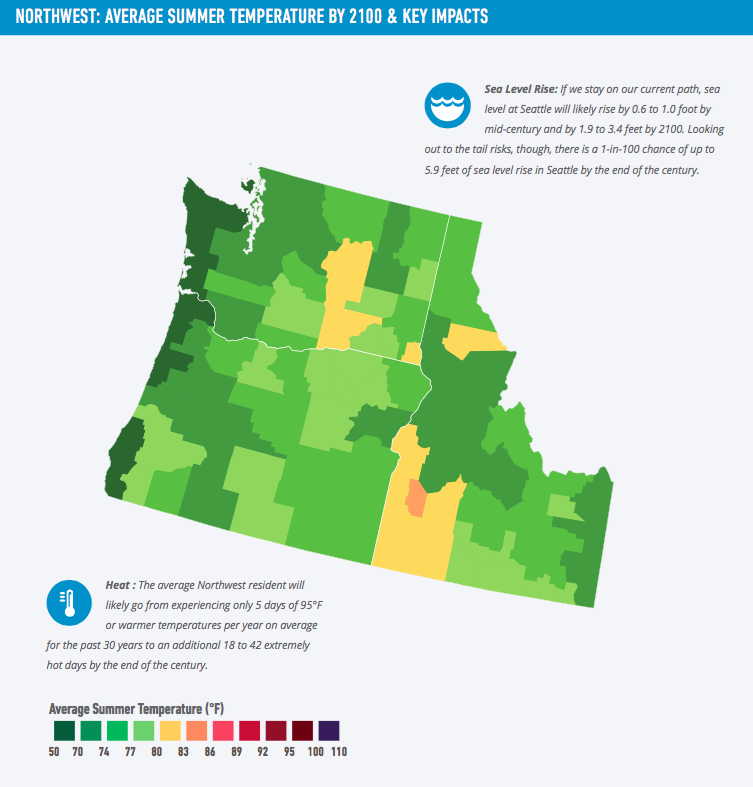
- By the middle of this century, the average American will likely see 27 to 50 days over 95°F each year—two to more than three times the average annual number of 95°F days we’ve seen over the past 30 years. By the end of this century, this number will likely reach 45 to 96 days over 95°F each year on average.
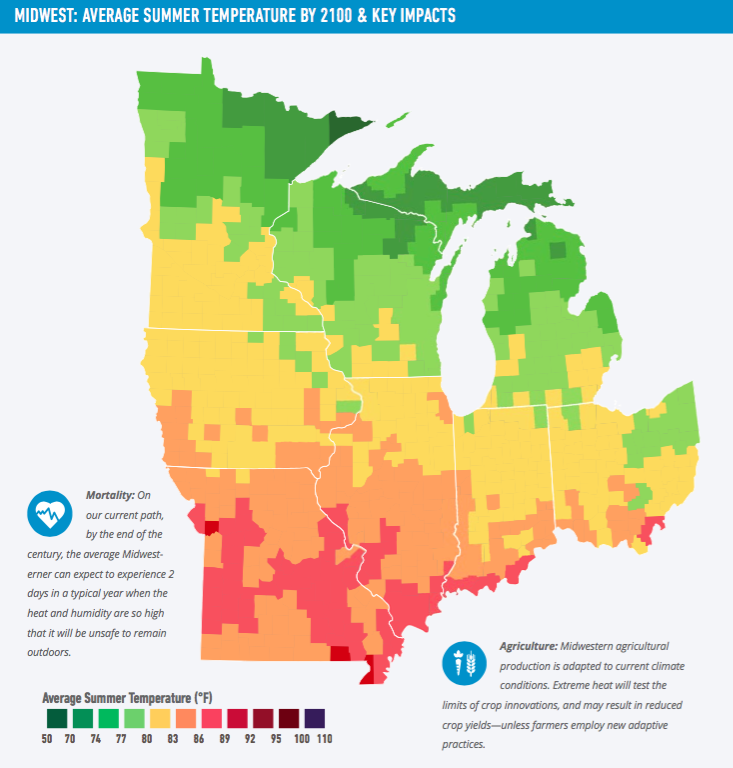
- As with sea level rise, these national averages mask regional extremes, especially in the Southwest, Southeast, and upper Midwest, which will likely see several months of 95°F days each year.
- Labor productivity of outdoor workers, such as those working in construction, utility maintenance, landscaping, and agriculture, could be reduced by as much as 3% by the end of the century, particularly in the Southeast. For context, labor productivity across the entire U.S. labor force declined about 1.5% during the famous “productivity slowdown” in the 1970s.3
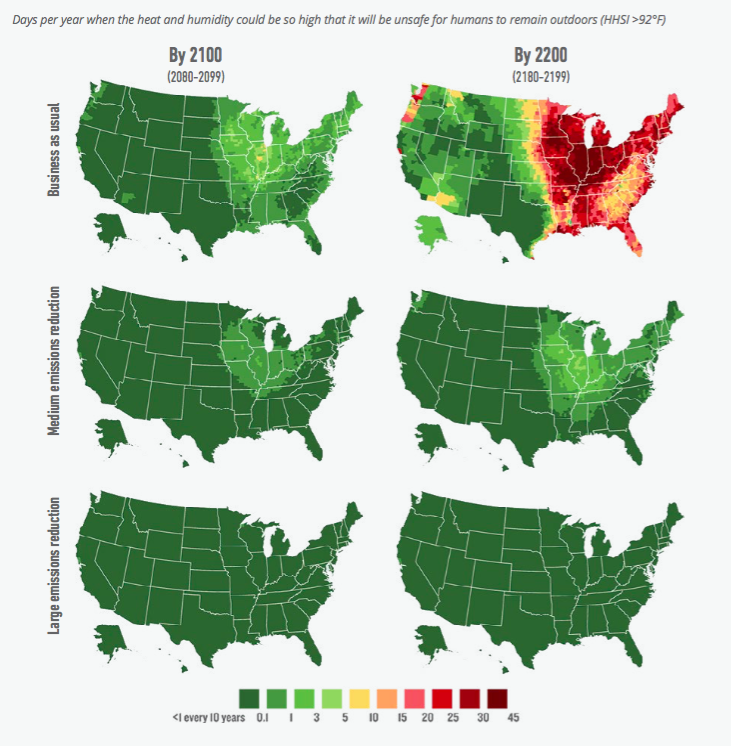
- Over the longer term, during portions of the year, extreme heat could surpass the threshold at which the human body can no longer maintain a normal core temperature without air conditioning, which we measure using a “Humid Heat Stroke Index” (HHSI). During these periods, anyone whose job requires them to work outdoors, as well as anyone lacking access to air conditioning, will face severe health risks and potential death.
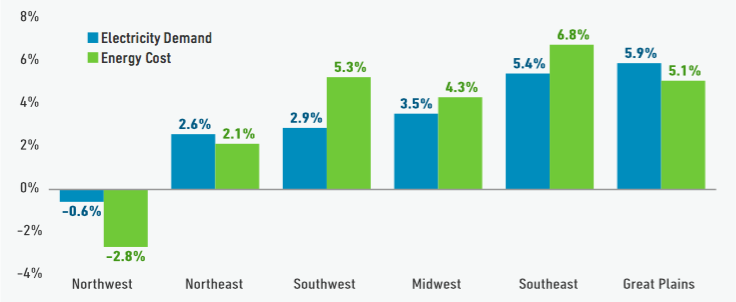
- Demand for electricity for air conditioning will surge in those parts of the country facing the most extreme temperature increases, straining regional generation and transmission capacity and driving up costs for consumers.
- Shifting agricultural patterns and crop yields, with likely gains for Northern farmers off set by losses in the Midwest and South
- As extreme heat spreads across the middle of the country by the end of the century, some states in the Southeast, lower Great Plains, and Midwest risk up to a 50% to 70% loss in average annual crop yields (corn, soy, cotton, and wheat), absent agricultural adaptation.
- At the same time, warmer temperatures and carbon fertilization may improve agricultural productivity and crop yields in the upper Great Plains and other northern states.
- Food systems are resilient at a national and global level, and agricultural producers have proven themselves extremely able to adapt to changing climate conditions. These shifts, however, still carry risks for the individual farming communities most vulnerable to projected climatic changes.
The Risky Business Project is designed to highlight climate risks to specific business sectors and regions of the economy, and to provide actionable data at a geographically granular level for decision-makers. It is our hope that it becomes standard practice for the American business and investment community to factor climate change into its decision-making process. We are already seeing this response from the agricultural and national security sectors; we are starting to see it from the bond markets and utilities as well. But business still tends to respond only to the extent that these risks intersect with core short term financial and planning decisions.
We also know that the private sector does not operate in a vacuum, and that the economy runs most smoothly when government sets a consistent policy and a regulatory framework within which business has the freedom to operate. Right now, cities and businesses are scrambling to adapt to a changing climate without suffcient federal government support, resulting in a virtual “unfunded mandate by omission” to deal with climate at the local level.4 We believe that American businesses should play an active role in helping the public sector determine how best to react to the risks and costs posed by climate change, and how to set the rules that move the country forward in a new, more sustainable direction.
With this report, we call on the American business community to rise to the challenge and lead the way in helping reduce climate risks. We hope the Risky Business Project will facilitate this action by providing critical information about how climate change may affect key sectors and regions of our national economy.
This is only a first step, but it’s a step toward getting America on a new path leading to a more secure, more certain economic future.